EUR/USD 5M
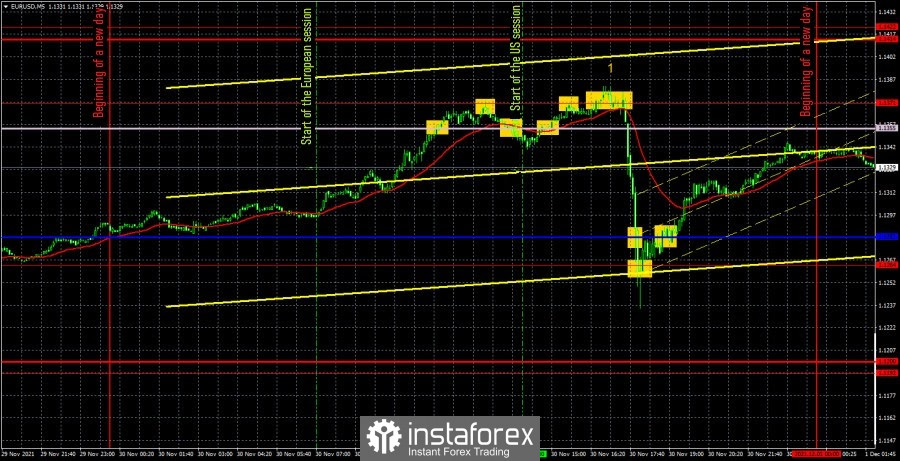
The EUR/USD pair showed truly crazy moves on Tuesday. What does it mean not only about the fall in the afternoon, but also about the growth in the morning. The pair gained 100 points in the Asian and European trading sessions alone. Considering the fact that at this time there were no important macroeconomic publications or other fundamental events, such a rise in the European currency looks rather strange. If the pair rose by 50-60 points, it would be normal for it, as it corresponds to its average volatility values. But 100 points in half a day with an empty calendar of macroeconomic events is too much for the euro. Nevertheless, this movement happened, and in the afternoon a collapse followed. The euro quotes fell by 140 points in just an hour. It happened during the speech of the head of the Federal Reserve in the Senate. It is not yet known for certain what exactly the markets reacted to, but it can be assumed that Fed Chairman Jerome Powell stunned them with something. Most likely, the likelihood of a tightening of monetary policy has grown significantly after Powell's speech, as recently the markets are very fond of buying the dollar, based on their own expectations of the Fed's actions. We only have to figure out how the pair should have been traded yesterday. To begin with, there were only 16 points between the Senkou Span B line and the extremum level of 1.1371, so they should be considered as an area of resistance. Just in case, we marked all trading signals, but we should have considered only bounces from the level of 1.1371. To be more precise, it was only the first bounce, after which the pair dropped below the Senkou Span B. It was at this time that short positions should have been opened. But the hardest part came later. The pair returned to the level of 1.1371 and even left for a short while and slightly above it, but this could not be considered as overcoming. A very subtle and ambiguous situation. We would even say "borderline". Short positions should not be closed, since this level was not overcome. We also did not expect that Powell's second speech in Congress would be followed by such a market reaction. Therefore, and for this reason, the shorts should not be closed. As a result, it was possible to earn "out of the blue" about 75 points. Short positions should have been closed after the rebound from the level of 1.1264. Although, of course, it was impossible to predict such a movement or catch it along the way.
EUR/USD 1H

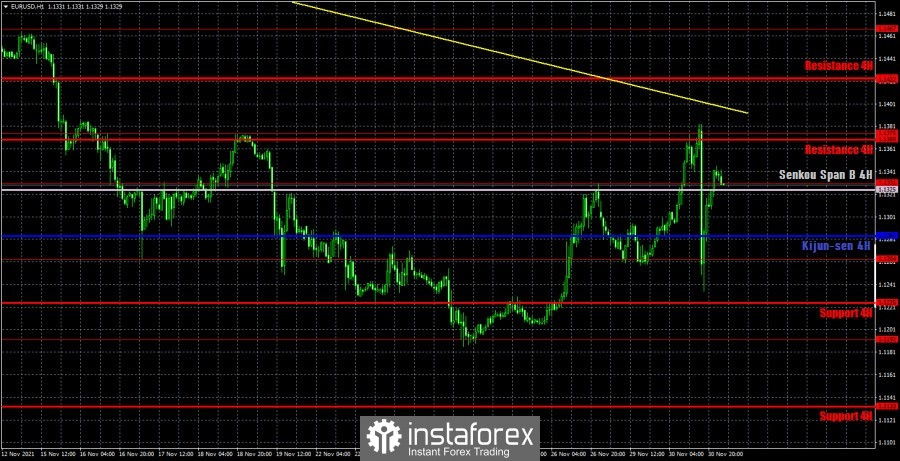
On the hourly timeframe, the downward trend persists as the trend line is still relevant. Yesterday's fall in the pair raises many questions. Especially when it comes to validity. However, today we will find out why it happened and we will be able to draw the appropriate conclusions. So far, it cannot be concluded that traders have given up buying the euro, but it cannot be concluded that they have decided to resume selling the pair. On Wednesday, we highlight the following levels for trading - 1.1192, 1.1264, 1.1331, 1.1375, 1.1422, as well as the Senkou Span B (1.1325) and Kijun-sen (1.1284) lines. The Ichimoku indicator lines can change their position during the day, which should be taken into account when looking for trading signals. Signals can be rebounds or breakthroughs of these levels and lines. Do not forget about placing a Stop Loss order at breakeven if the price moves 15 points in the right direction. This will protect you against possible losses if the signal turns out to be false. Only the manufacturing PMI will be published in the European Union on December 1, and the ISM manufacturing index will be published in the US, which may also arouse interest among traders.
We recommend you to familiarize yourself:
Overview of the EUR/USD pair. December 1. Christine Lagarde: The eurozone is ready for a new "wave" of the pandemic
Overview of the GBP/USD pair. December 1. France and the UK are in conflict over migrants. Powell warns of the risks associated with the Omicron
Forecast and trading signals for GBP/USD for December 1. Detailed analysis of the movement of the pair and trade deals.
Analysis of the COT report
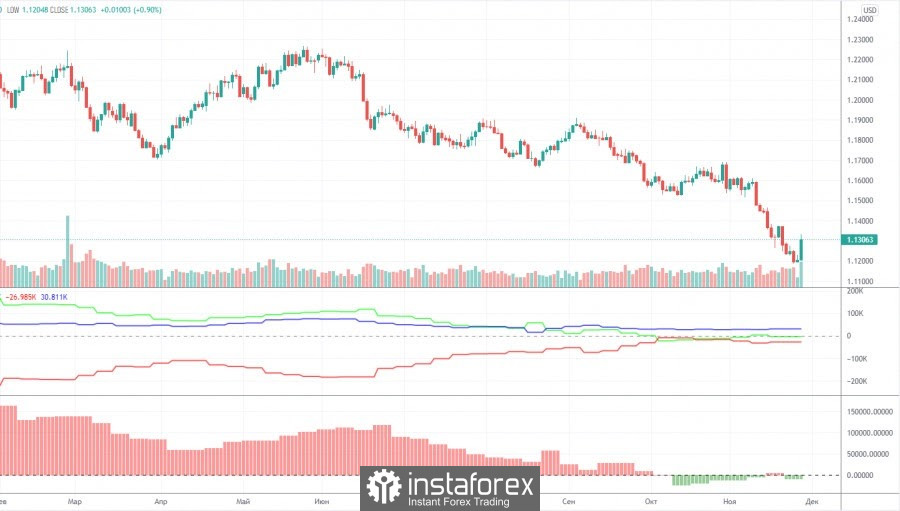
The mood of non-commercial traders changed quite significantly during the last reporting week (November 9-15). A group of non-commercial traders opened 7,000 buy contracts (longs) and 20,500 sell contracts (shorts) during the week. Thus, the net position for professional traders decreased by 13,500, and the mood became more "bearish". It should be noted that the European currency has dropped quite seriously over the past few weeks. But the net position for the "non-commercial" group, starting from October, practically does not change. This is signaled by the green line of the first indicator in the chart above. Almost all this time, it has been near the zero level, indicating the absence of serious changes in the mood of major players. Thus, if the general trend remains the same - over the past ten months, large players have seriously reduced the number of longs and increased the number of shorts, then in the past few weeks nothing of the kind has been observed, and the European currency was still falling. This suggests that what is happening on the market now does not quite correspond to the actions of large players. The second indicator (the net position for professional traders in the form of a histogram) shows that in the last six weeks the mood of traders has become less bearish, that is, in theory, at this time the euro should have been growing, not falling. Thus, if we draw a conclusion only on the basis of the Commitment of Traders (COT) reports, then a further fall in the euro currency is completely unclear.
Explanations for the chart:
Support and Resistance Levels are the levels that serve as targets when buying or selling the pair. You can place Take Profit near these levels.
Kijun-sen and Senkou Span B lines are lines of the Ichimoku indicator transferred to the hourly timeframe from the 4-hour one.
Support and resistance areas are areas from which the price has repeatedly rebounded off.
Yellow lines are trend lines, trend channels and any other technical patterns.
Indicator 1 on the COT charts is the size of the net position of each category of traders.
Indicator 2 on the COT charts is the size of the net position for the non-commercial group.