Here are the details of the economic calendar for November 30, 2021:
Yesterday, traders' attention was focused on preliminary data on Eurozone's inflation. It was predicted that its level would accelerate from 4.1% to 4.5%, but as a result, the growth was up to 4.9%. The situation with rapidly rising inflation and the ECB's inaction scares investors, which leads to speculative surges in the market.
The euro started to decline when inflation data was released, but after a while, there was a reverse course. This is the speculative mood of market participants.
The main surge in activity occurred during the US trading session, where Fed Chairman Jerome Powell, during a hearing in the Senate Banking Committee in Washington, announced the possible early termination of US economic stimulus several months ahead of schedule. This comment was instantly picked up by speculators, which led to a sharp strengthening of dollar positions in the market.
Analysis of trading charts from November 30:
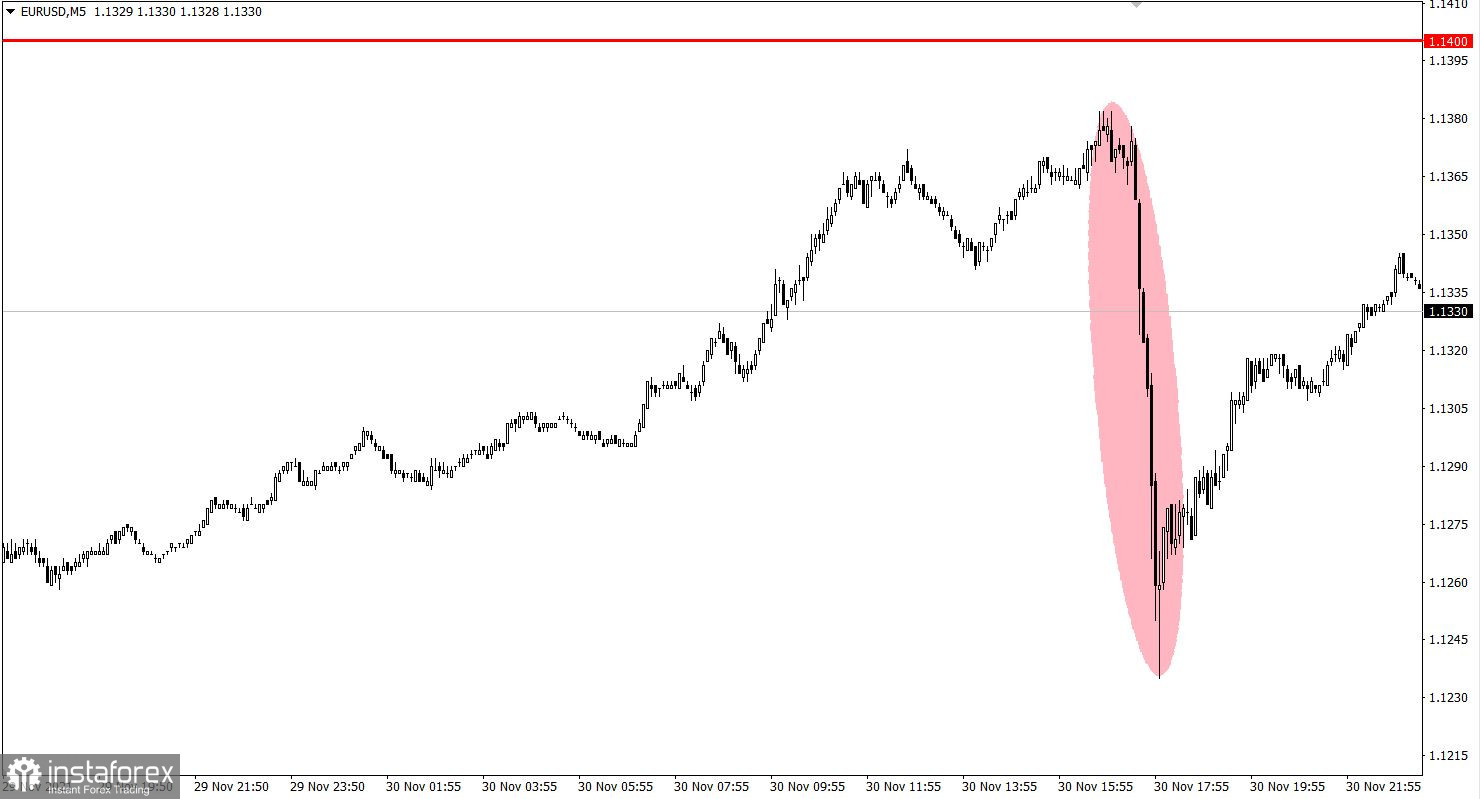
The EUR/USD pair approached the resistance level of 1.1400 following the correction pattern, where the volume of short positions decreased. This led to a price rebound and a partial recovery of downward interest in the market.
Analyzing the price rebound in detail, it shows that the main lever in the market was the information background associated with Jerome Powell's comment. This caused a speculative stir, which coincided with the resistance area.
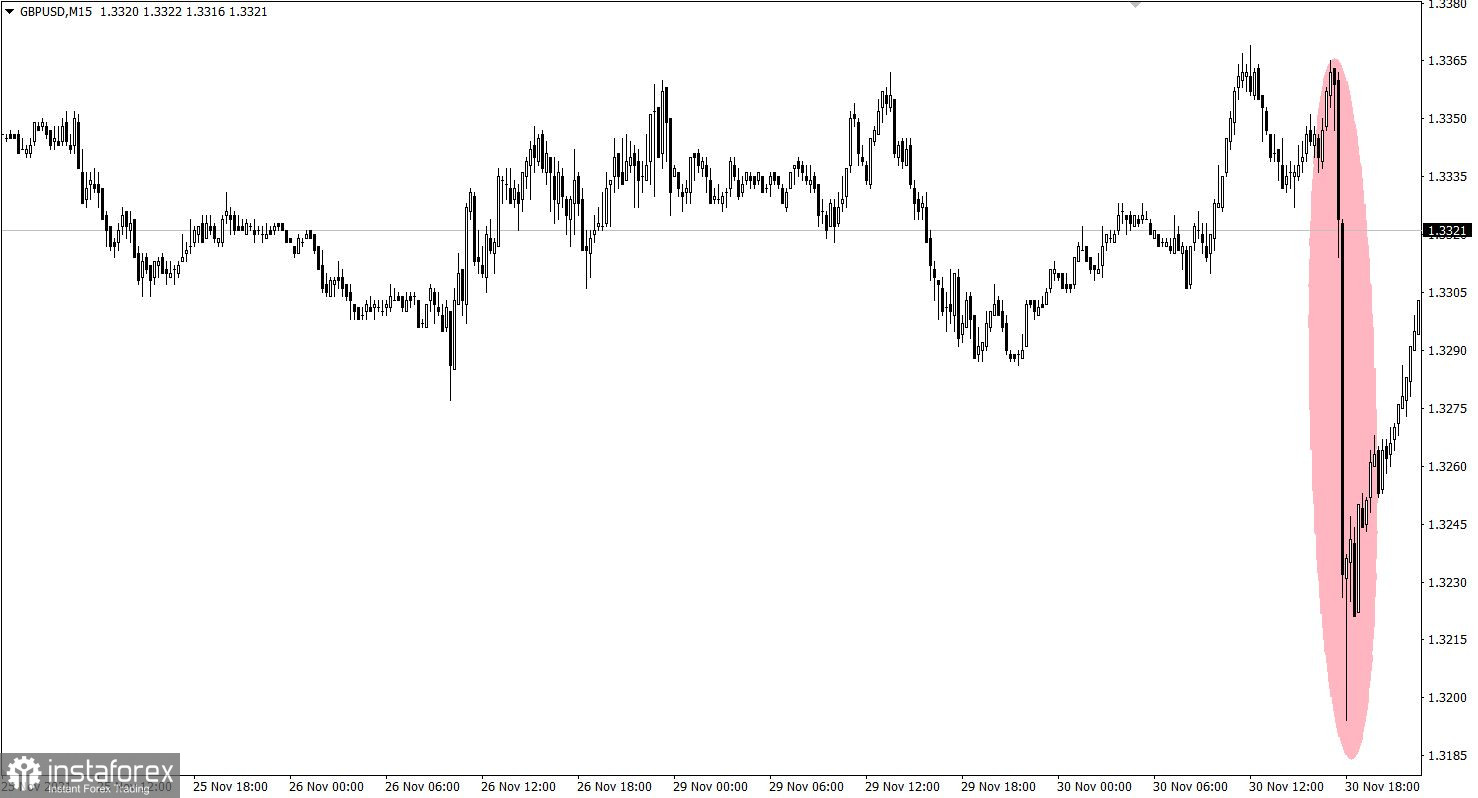
The side channel in the range of 1.3290/1.3350 for the GBP/USD pair ended with a breakdown of the lower border. This led to a surge in activity and an update of the local low of 2021. It should be noted that the speculative hype and the breakdown of the lower border are associated with the same information background as for the euro. Therefore, the main lever in the market yesterday was not technical analysis, but the game of speculators on the flow of information.
December 1 economic calendar:
The ADP report will be published at 13:15 Universal time today, where it is expected that US employment will grow by 525 thousand in the period of November, which is slightly less than 571 thousand in the previous month.
On the one hand, we see a decrease in employment relative to the previous reporting period, but on the scale of the labor market, employment indicators are still very high. In this case, the US dollar has a chance of further strengthening.
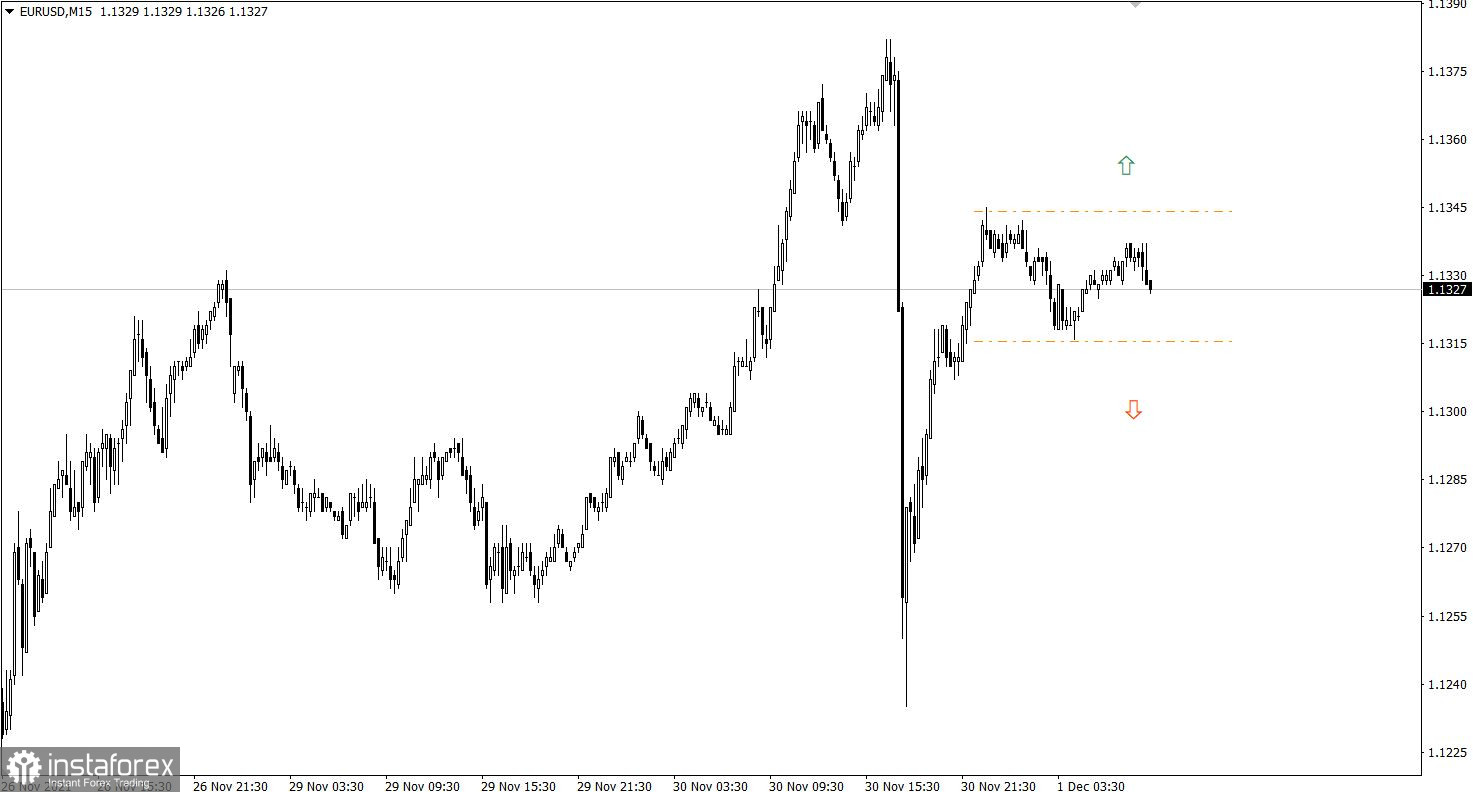
Trading plan for EUR/USD on December 1:
After a series of speculative surges, the market stagnated in the range of 1.1315/1.1345. There is a process of accumulation of trading forces, which as a result will lead to new speculative surges in the market.
In this situation, the most appropriate trading tactic is considered to be a breakdown of one or another border of the established range.
Trading recommendations
Buy positions should be considered after holding the price above the level of 1.1350.
Sell positions should be considered after holding the price below the level of 1.1305.
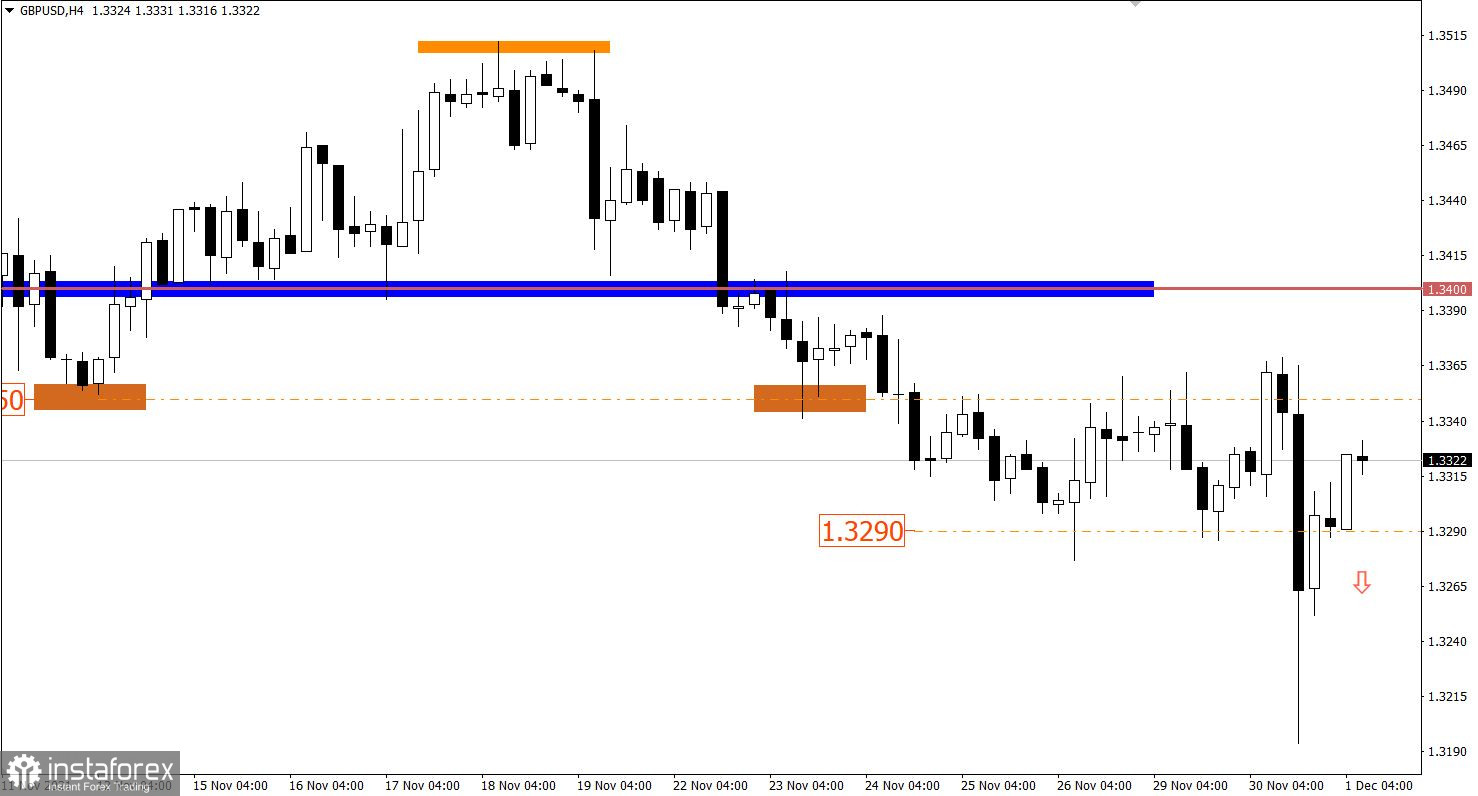
Trading plan for GBP/USD on December 1:
Despite the fact that speculators have already broken the side range of 1.3290/1.3370, the quote still pays attention to it. Thus, the return of the price below the value of 1.3290 will increase the sellers' chance of a subsequent decline. Otherwise, the side channel may be delayed for some time.
What is reflected in the trading charts?
A candlestick chart view is graphical rectangles of white and black light, with sticks on top and bottom. When analyzing each candle in detail, you will see its characteristics of a relative period: the opening price, closing price, and maximum and minimum prices.
Horizontal levels are price coordinates, relative to which a stop or a price reversal may occur. These levels are called support and resistance in the market.
Circles and rectangles are highlighted examples where the price of the story unfolded. This color selection indicates horizontal lines that may put pressure on the quote in the future.
The up/down arrows are the reference points of the possible price direction in the future.