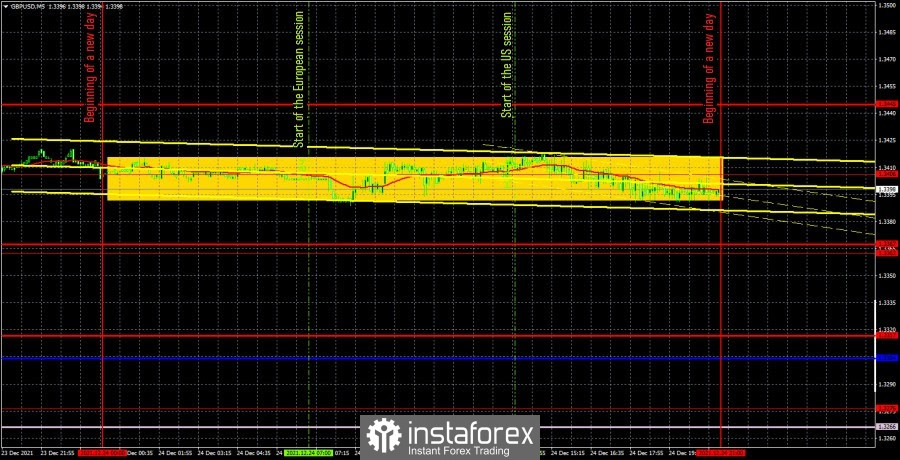
GBP/USD 5M
The GBP/USD pair moved between the levels of 1.3389 and 1.3417 on Friday. Needless to say, it was impossible to trade in such a narrow range. This was fraught with either the formation of a heap of false signals, or the absence of them at all. Formally, this was the first option, since the pound/dollar pair was trading around the extreme level of 1.3406 all day. However, the flat movement was so obvious... It began at night, and continued in the European and US sessions. Thus, with an absolutely empty calendar of macroeconomic events, it was definitely not worth entering the market. In addition, as we have already said, Friday had the status of a half-day off.
GBP/USD 1H
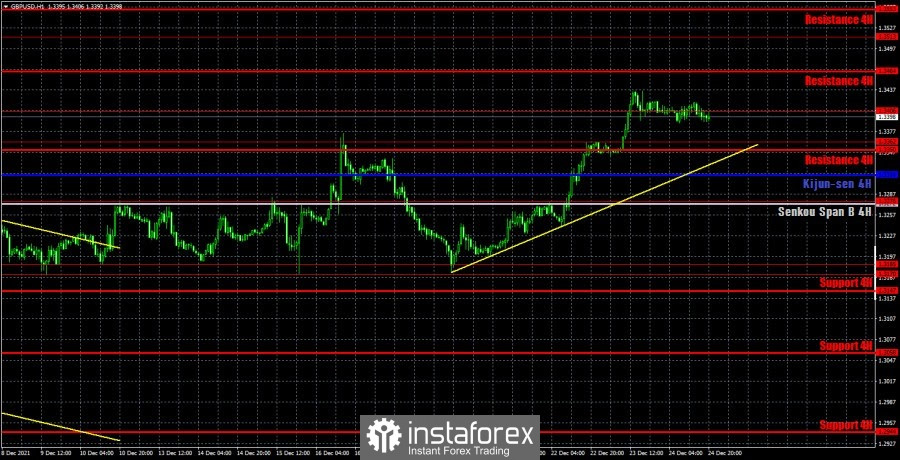
On the hourly timeframe, the pound/dollar pair continues to remain in the upward trend that was formed last week. At the end of the year, the pair as a whole shows quite good volatility, and the pound - a desire to grow in price. Thus, until the price settles below the trend line, we look forward to the continuation of the upward movement. We distinguish the following important levels on December 27: 1.3276, 1.3362, 1.3406, 1.3513. Senkou Span B (1.3272) and Kijun-sen (1.3314) lines can also be signal sources. Signals can be "rebounds" and "breakthroughs" of these levels and lines. It is recommended to set the Stop Loss level at breakeven when the price passes 20 points in the right direction. The Ichimoku indicator lines can move during the day, which should be taken into account when looking for trading signals. The calendars of macroeconomic events are empty in the UK and the United States on Monday, so the "foundation" will have no influence on the pound/dollar pair's movement. Nevertheless, the pair may continue to show good volatility, as it is not currently inside the horizontal channel.
We recommend you to familiarize yourself:
Overview of the EUR/USD pair. December 27. The "Coronavirus Holidays" have begun.
Overview of the GBP/USD pair. December 27. UK: Disease continues to rise.
Forecast and trading signals for EUR/USD for December 27. Detailed analysis of the movement of the pair and trade deals.
COT report
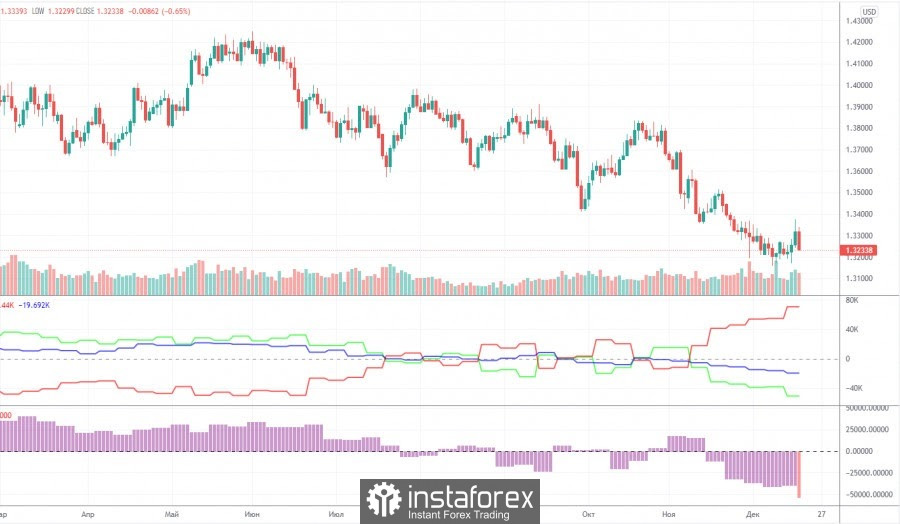
The mood of commercial traders was much more bearish during the last reporting week (December 7-13). Commercial traders closed 6,700 sell contracts (shorts) and 20,100 buy contracts (longs) during the week. Thus, the net position for the "non-commercial" group of traders decreased by 13,400 contracts, which is a lot for the pound. Thus, unlike the euro currency, the pound, according to COT reports, continues to fall quite reasonably: major players continue to sell it. However, the green and red lines of the first indicator (which mean the net positions of the non-commercial and commercial groups) have already moved far away from each other. Recall that such a deletion signals the imminent end of the trend. However, as with any fundamental assumptions, specific technical signals are required to work out this hypothesis, which are not currently available. If we do not take into account the increase in the key rate by the Bank of England, then there are no special fundamental reasons for the growth of the pound now either. Recall that Prime Minister Boris Johnson continues to get into various scandals in Great Britain and there is already talk that he will leave his post before the end of the deadline. The pandemic in the UK is gaining momentum and the other day an anti-record was set for the daily number of infections. Omicron is also spreading quite rapidly across the country, creating additional risks for the healthcare system and the economy. London, on the other hand, cannot find a common language with Paris and Brussels, which threatens it with the deterioration of relations with its closest neighbors and the loss of markets for the sale of products. But there is no positive news.
Explanations for the chart:
Support and Resistance Levels are the levels that serve as targets when buying or selling the pair. You can place Take Profit near these levels.
Kijun-sen and Senkou Span B lines are lines of the Ichimoku indicator transferred to the hourly timeframe from the 4-hour one.
Support and resistance areas are areas from which the price has repeatedly rebounded off.
Yellow lines are trend lines, trend channels and any other technical patterns.
Indicator 1 on the COT charts is the size of the net position of each category of traders.
Indicator 2 on the COT charts is the size of the net position for the non-commercial group.