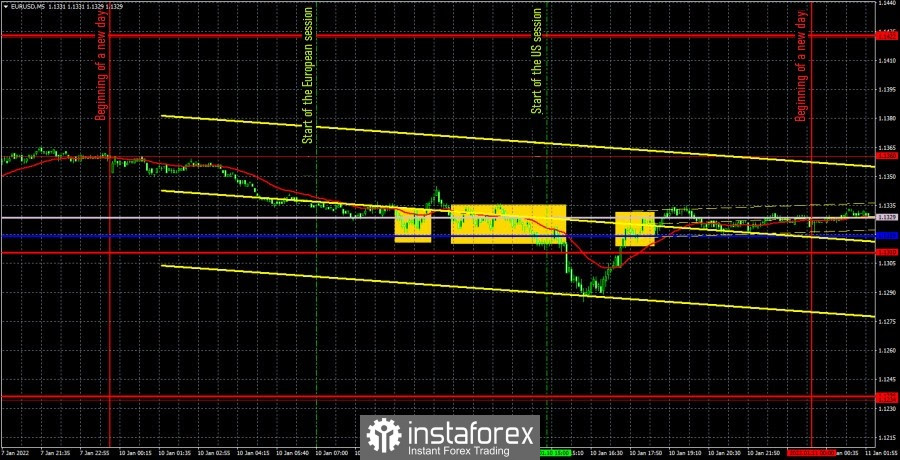
EUR/USD 5M

The EUR/USD pair was trading in a very strange way during the first trading day of the week. No, the movement itself was quite good, if we consider it as an intraday trend. However, at the same time, the pair fell by 70 points during the day, although it showed exactly the same movement on Friday. It was only on Friday that the most important reports on unemployment and NonFarm Payrolls, as well as on European inflation, were published in the United States, and on Monday there were no important reports either in the US or in the EU. Moreover, the pair fell exactly to the level of 1.1293, from which it began to grow on Friday. It seems that traders simply returned the pair's debt for January 7. In addition, the euro/dollar pair continues to remain inside the 1.1234–1.1360 horizontal channel. Despite the fact that in recent weeks it has been located only in the upper part of it, the channel itself is still relevant. However, now it can already be adjusted to 1.1270-1.1360. We have also already noted that the minimum upward slope is also present, but it is still impossible to benefit from understanding this in any way. The lines of the Ichimoku indicator on the flat are weak, which is clearly visible on the hourly TF below. It remains only to deal with Monday's trading signals. Perhaps the strongest signal was formed at night, when the price bounced off the upper boundary of the 1.1360 horizontal channel. However, we do not consider night signals. But during the day, the pair formed exclusively false signals and the main task was to avoid losses. The first buy signal was formed when the price bounced off the Senkou Span B line. However, after that, the pair managed to go up "as much as" 10 points, which was not enough even to place a Stop Loss order at breakeven. Subsequently, the quotes fell below both lines of the Ichimoku indicator, which should have already been considered as a sell signal. The long position closed at a loss of about 20 points. It was necessary to open a short position in order to to consolidate below the critical line, but the pair failed to continue its downward movement, although this time it still went down about 30 points, so the deal closed at a Stop Loss at breakeven. The last third signal should no longer be considered.
We recommend you to familiarize yourself:
Overview of the EUR/USD pair. January 11. The week began very calmly for the European currency.
Overview of the GBP/USD pair. January 11. The UK continues to set sad anti-coronavirus records.
Forecast and trading signals for GBP/USD for January 11. Detailed analysis of the movement of the pair and trade deals.
EUR/USD 1H
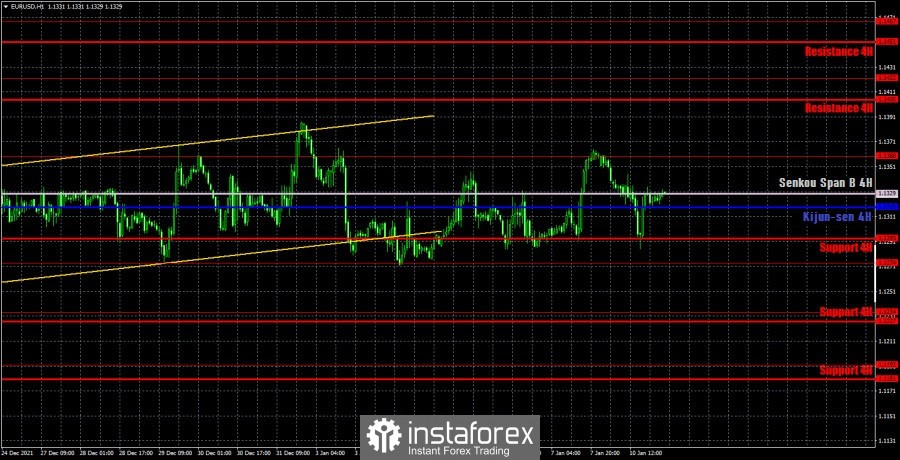
The technical picture on the hourly timeframe does not change completely. The price continues to remain between the levels of 1.1234 and 1.1360 for a month and a half, so no other conclusion can be made now: the flat remains. And if so, then the lines of the Ichimoku indicator are weak now, the pair's movements are as unpredictable as possible. On Tuesday, we allocate the following levels for trading - 1.1234, 1.1274, 1.1360, 1.1422, as well as the Senkou Span B (1.1329) and Kijun-sen (1.1319) lines. The lines of the Ichimoku indicator may change their position during the day, which should be taken into account when searching for trading signals. Signals can be "bounces" and "surmounts" of these levels and lines. Do not forget about placing a Stop Loss order at breakeven if the price went in the right direction of 15 points. This will protect against possible losses if the signal turns out to be false. You should also take into account the fact that flat is very likely now again, so the lines of the Ichimoku indicator are weak. On January 11, European Central Bank President Christine Lagarde will give a speech in the European Union, and Federal Reserve Chairman Jerome Powell will give a speech in the United States. Theoretically, both of these speeches can provoke the pair's movement, since these will be the first speeches of functionaries in the new year. But we wouldn't count on too much either.
Explanations for the chart:
Support and Resistance Levels are the levels that serve as targets when buying or selling the pair. You can place Take Profit near these levels.
Kijun-sen and Senkou Span B lines are lines of the Ichimoku indicator transferred to the hourly timeframe from the 4-hour one.
Support and resistance areas are areas from which the price has repeatedly rebounded off.
Yellow lines are trend lines, trend channels and any other technical patterns.
Indicator 1 on the COT charts is the size of the net position of each category of traders.
Indicator 2 on the COT charts is the size of the net position for the non-commercial group.