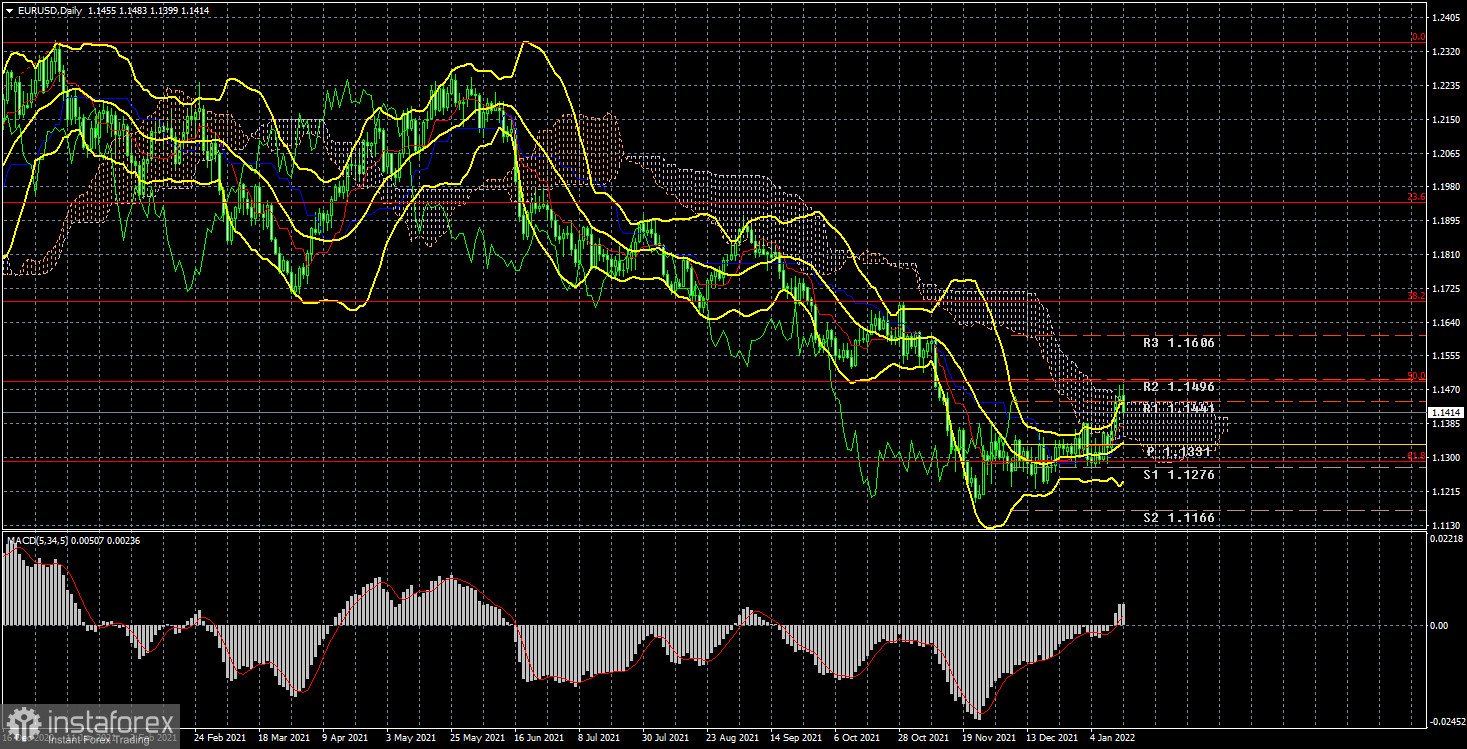
The European currency ended last week with a significant increase. It wasn't too big, but at the same time, the pair hadn't shown such growth for quite some time. We also drew the attention of traders to the fact that the pair had no fundamental reasons for growth. Rather, on the contrary. There were new good reasons for the US dollar to grow. This is a whole series of speeches by representatives of the Fed, who only intensified their "hawkish" rhetoric. This is also the speech of Jerome Powell, who confirmed the Fed's intentions to continue tightening monetary policy. This is also the inflation report, which showed another acceleration of it. From a technical point of view, growth has been brewing for a long time. However, this growth is either corrective or growth based on the fact that all the "dollar" factors have already been worked out by the market. This is the moment we have to deal with next week. If what we have seen this week is just a correction, then it will probably end soon. Already, the pair ran into the Senkou Span B line on the 24-hour TF and could not overcome it. Therefore, a rebound from this line can trigger a new round of the downward trend. If the second assumption is true, then the Senkou Span B line will be overcome and the growth of the European currency will continue, which, from a fundamental point of view, is not based on anything. Recall that there is nothing in the European Union now that could support the European currency. Traders are most depressed by the passivity of the ECB, which does not even plan to raise the key rate in the coming year.
Last week, as already mentioned, traders ignored almost the entire fundamental and macroeconomic background. Thus, it is far from a fact that they will start paying attention to it in the new week. However, also, with some delay, they can begin to work out the "foundation" of last week. Therefore, I consider the Senkou Span B line to be the key in analyzing what is happening. However, you should also consider those events that are scheduled for next week. Nothing interesting is planned in the European Union on Monday, Tuesday, and Wednesday. Only on Thursday will the inflation report for December be published, but this will be its second, final assessment. That is, the markets are already ready for the value of 5.0% YoY and are unlikely to react to this data. On Friday, the calendar in the European Union is empty. Among other important events, we note the speech of Christine Lagarde on Friday, but, as usual, the head of the ECB is unlikely to "shock" the markets with important information. Now everyone understands that the European economy is not ready for a strong tightening. The "wave" of Omicron is in full swing and no one knows what its consequences will be. Doctors and epidemiologists say that up to 50% of the population in the European Union may get sick in the next two months. And this means that there is no talk about the imminent end of this "wave" yet. Consequently, the ECB at its next meeting is unlikely to pour right and left "hawkish" theses. The same goes for Christine Lagarde's Friday speech. It turns out that next week we are not waiting for anything interesting in the European Union. All the more interesting, since there will be mainly technical factors in the case, and the mood of traders will be influenced by a minimum of external factors.
Trading recommendations for the EUR/USD pair:
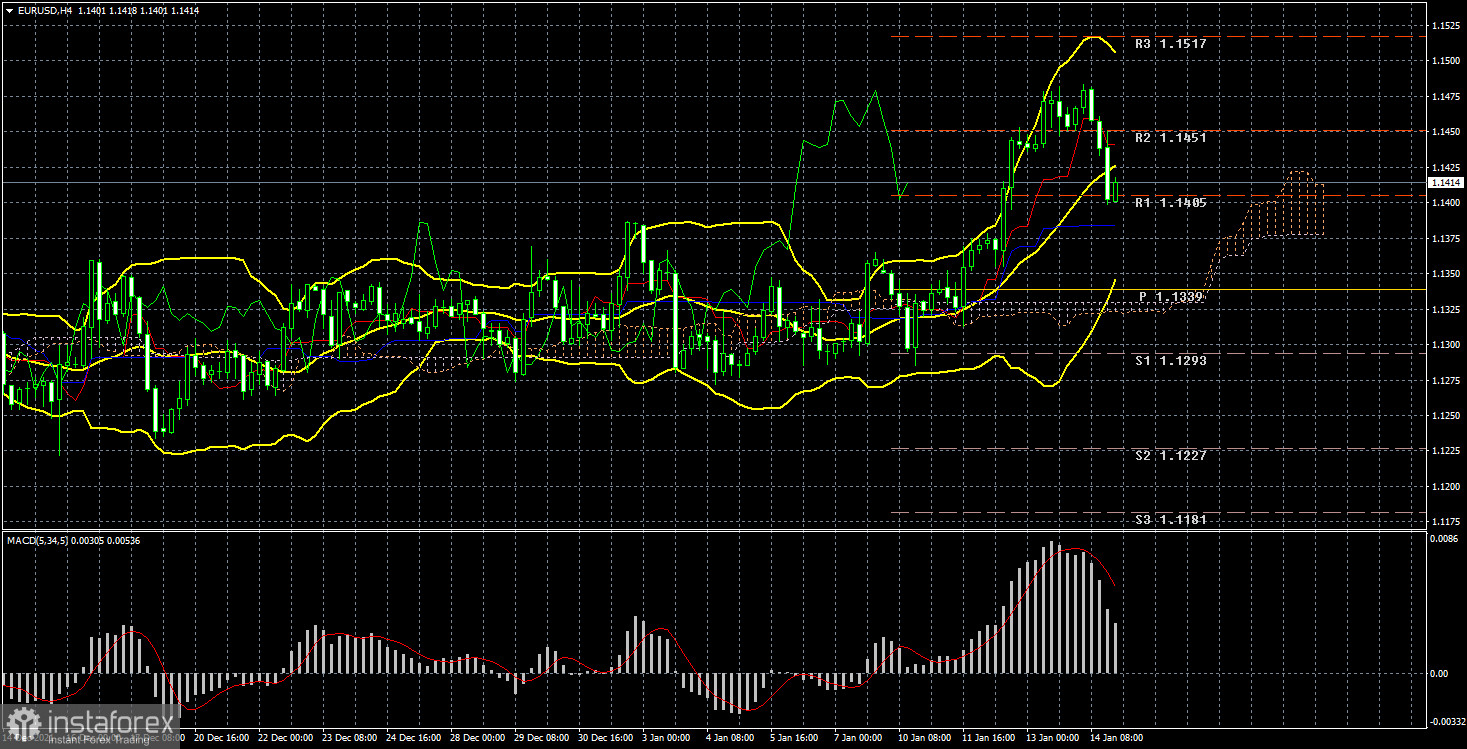
The technical picture of the EUR/USD pair on the 4-hour chart according to the Ichimoku strategy looks extremely eloquent. The pair made an impressive upward leap last week, and on Friday it began to adjust to the critical line. If there is a rebound from it, then the upward movement may resume. But more important now is the rebound from the Senkou Span B line on the 24-hour TF. Based on it, it is more likely that the pair will overcome the Kijun-sen line. In this case, the price may rush back to its annual lows. In case of a rebound from the critical line, the pair may once again try to grow to the 15th level.
Explanations to the illustrations:
Price levels of support and resistance (resistance /support), Fibonacci levels - target levels when opening purchases or sales. Take Profit levels can be placed near them.
Ichimoku indicators (standard settings), Bollinger Bands (standard settings), MACD (5, 34, 5).