empty
 
 
08.12.2022 07:52 PM
Technical analysis of EUR/USD for December 08, 2022

This image is no longer relevant

Overview :

Our sentiment on the EUR/USD pair - EUR vs.

US Dollar :

- Short term : Bullish market in short term.

- Tacit : Bullish market in long term.

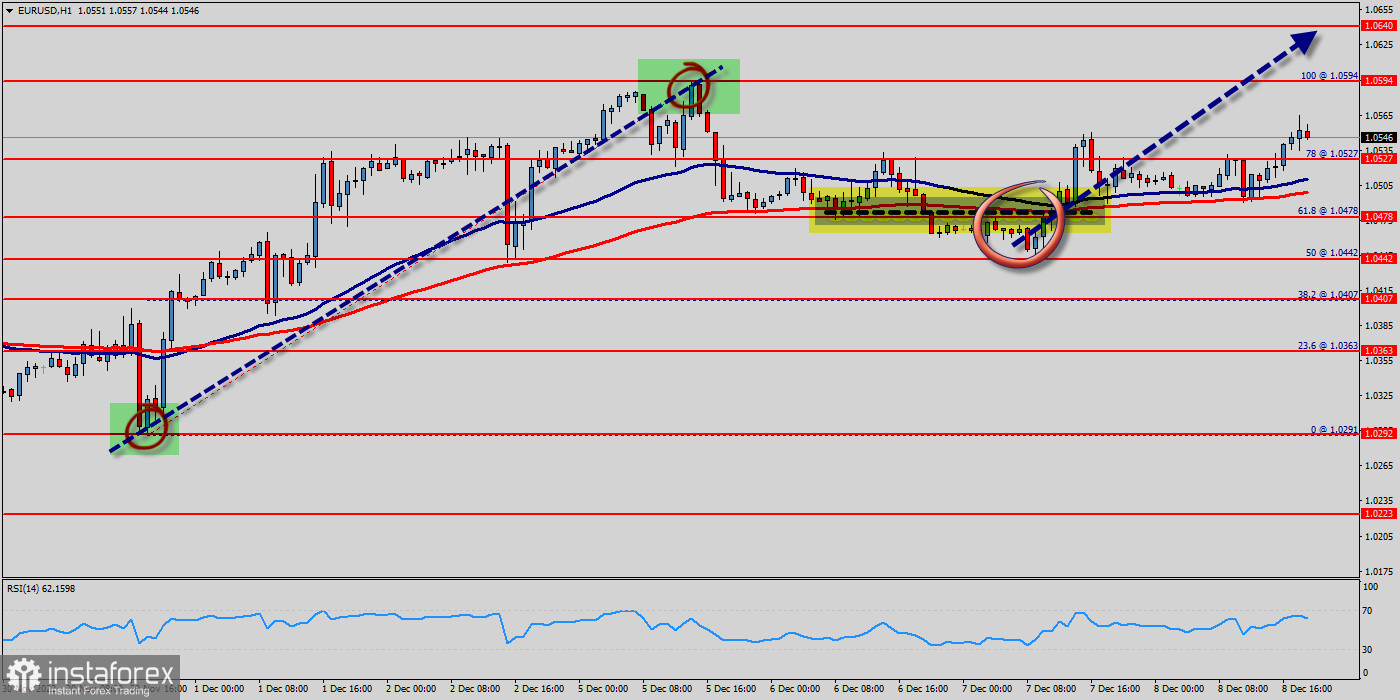
The bullish trend is currently very strong on the EUR/USD pair. As long as the price remains above the support levels of 1.0478 and 0.9700, you could try to benefit from the growth. The first bullish objective is located at the price of 1.0594. The bullish momentum would be boosted by a break in this resistance (1.0527). The hourly chart is currently still bullish. At the same time, some stabilization tendencies are visible between 1.0527 and 1.0594 in a few minutes. Together with the relatively large distance to the fast-rising 100-day moving average (1.0527), there are some arguments for a relief rally in coming months on the table. The EUR/USD pair is at highest against the dollar around the spot of 1.0478 and 1.0500 this week - the EUR/USD pair is inside in upward channel. The EUR/USD pair decreased within an up channel, for that the EUR/USD pair its new highest 1.0594. Consequently, the first support is set at the level of 1.0527. Hence, the market is likely to show signs of a bullish trend around the area of 1.0527.

Moreover, the double bottom is also coinciding with the major support this week. Additionally, the RSI is still calling for a strong bullish market as well as the current price is also above the moving average 100. Therefore, it will be advantageous to buy above the support area of 1.0478.

Commonly, traders use the RSI (Relative Strength Index) to define what? Areas that are potentially overbought or oversold.

Overall, RSI readings below 30 indicate that the pair is oversold, while RSI readings over 70 indicate that it is overbought.

Buyers would then use the next resistance located at 1.0594 as an objective. Crossing it would then enable buyers to target 1.0594 (the double top - last bullish week).

Be careful, given the powerful bullish rally underway, excesses could lead to a possible correction in the short term. If this is the case, remember that trading against the trend may be riskier. It would seem more appropriate to wait for a signal indicating reversal of the trend. The EUR/USD pair price could be awaiting a major upswing if the digital savings manages to slice above a fatal line of the first resistance that sets at the price of 1.0594 (Horizontal red line).

The prevailing chart pattern suggests that if the leading pair could be expecting to rebound from the levels of 1.0500 and 1.0594 . On the day, this instrument gained abou +0.85% and was traded between 1.0500 and 1.0600 USD over the period.

The price is currently at +1.25% from its lowest and -0.25% from its highest. If the EUR/USD pair fails to break through the support prices of 1.0478 USD today, the market will rise further to 1.0594 so as to try to break it.

The EUR/USD pair is one the best overall investment for December 08, 2022. However, if you want to try to improve the growth of the EUR/USD pair, thus it seems great to buy above the last bearish waves of 1.0478.

Re-buy orders are recommended above the major resistance rates of (0.9898) with the second target at the level of 1 USD. Furthermore, if the trend is able to breakout through the second resistance level of 1.0640 USD.

We should see the pair climbing towards the next target of 1.0640 The pair will move upwards continuing the development of the bullish trend to the level 1.0640. It might be noted that the level of 1.0640 is a good place to take profit because

it will form a new double top in coming hours. The general bullish opinion of this analysis is in opposition with technical indicators. As long as the invalidation level of this analysis is not breached, the bullish direction is still favored, however the current short-term correction should be carefully watched. The bulls must break through 1.0550 in order to resume the uptrend.

Mourad El Keddani,
الخبير التحليلي لدى شركة إنستافوركس
© 2007-2023
EURUSD
Euro vs US Dollar
Select timeframe
5
min
15
min
30
min
1
hour
4
hours
1
day
1
week
Start trade
Start trade
  • Grand Choice
    Contest by
    InstaForex
    InstaForex always strives to help you
    fulfill your biggest dreams.
    انضم إلى المسابقة
  • إيداع الحظ
    قم بإيداع 3,000 دولار في حسابك واحصل على $5,000 وأكثر من ذالك!
    في مارس نحن نقدم باليانصيب $5,000 ضمن حملة إيداع الحظ!
    احصل على فرصة للفوز من خلال إيداع 3,000 دولار في حساب تداول. بعد أن استوفيت هذا الشرط، تصبح مشاركًا في الحملة.
    انضم إلى المسابقة
  • تداول بحكمة، اربح جهازا
    قم بتعبئة حسابك بمبلغ لا يقل عن 500 دولار ، واشترك في المسابقة ، واحصل على فرصة للفوز بأجهزة الجوال.
    انضم إلى المسابقة
  • بونص 100٪
    فرصتك الفريدة للحصول على بونص 100٪ على إيداعك
    احصل على بونص
  • بونص 55٪
    تقدم بطلب للحصول على بونص 55٪ على كل إيداع
    احصل على بونص
  • بونص 30٪
    احصل على بونص 30٪ في كل مرة تقوم فيها بتعبئة حسابك
    احصل على بونص

Recommended Stories

التحليل الفني لزوج الاسترالي مقابل الدولار ليوم 29 يوليو 2022.

استمر زوج دولار استرالي / أمريكي في التحرك صعودًا من المستوى 0.6900. هذا الأسبوع ، ارتفع الزوج من مستوى 0.6900 (دعم أسبوعي) إلى القمة حول 0.7034. واليوم ، نرى مستوى

Mourad El Keddani 18:30 2022-07-29 UTC+2

تحليل اليورو دولار ليوم 28 يوليو 2022: راقب اختراق نطاق التداول الجانبي

التحليل الفني: يتداول زوج اليورو / الدولار الأمريكي بشكل جانبي في الأيام السبعة الماضية وهناك احتمالية لحدوث اختراق. توصية التداول: نظرًا للوضع الجانبي ، أرى إمكانية حدوث اختراق. في حالة

Petar Jacimovic 18:19 2022-07-29 UTC+2

تحليل المؤشرات: المراجعة اليومية لزوج اليورو/الدولار الأمريكي ليوم 29 يوليو 2022

قد يتحرك زوج اليورو مقابل الدولار صعودًا من مستوى 1.0196 (مستوى إغلاق شمعة الأمس اليومية) إلى 1.0281 ، وهو مستوى تصحيح 50.0٪ (الخط المنقط الأحمر). بعد اختبار هذا المستوى ،

Stefan Doll 14:06 2022-07-29 UTC+2

احتمالية استمرار صعود زوج الجنيه الإسترليني/الدولار الأمريكي | 29 يوليو 2022

على الإطار الزمني لأربع ساعات، مع تحرك الأسعار داخل قناة صاعدة وفوق مؤشر إيشيموكو ، لدينا تحيز صعودي بأن السعر سيرتفع من مستوى الدعم الأول عند 1.21594، حيث يوجد

Dean Leo 13:40 2022-07-29 UTC+2

احتمالية استمرار صعود BTCUSDT يوم 29 يوليو 2022

على الإطار الزمني لأربع ساعات، مع كسر السعر للقناة الهابطة وتحركه فوق مؤشر إيشيموكو ، لدينا تحيز صعودي بأن السعر قد يرتفع من مستوى المقاومة الأولى عند 24700.55 ، والذي

Dean Leo 13:35 2022-07-29 UTC+2

تحليل المؤشرات. نظرة عامة يومية على زوج الجنيه الإسترليني/الدولار الأمريكي ليوم 29 يوليو 2022

يوم الخميس تحرك الزوج للأسفل في القناة الجانبية ، مع وجود الدعم عند 1.2102 (الخط الأحمر الغامق). ثم ارتفع السعر وأغلقت الشمعة اليومية عند 1.2173. اليوم قد يستمر في التحرك

Stefan Doll 12:35 2022-07-29 UTC+2

التحليل الفني لزوج الجنيه الإسترليني/الدولار الأمريكي ليوم 29 يوليو 2022

توقعات السوق الفنية: اخترق زوج الجنيه الإسترليني/الدولار الأمريكي فوق المقاومة الفنية قصيرة المدى وصنع قمة محلية جديدة عند المستوى 1.2244 (في وقت كتابة التحليل). تم كسر منطقة العرض الواقعة

Sebastian Seliga 12:02 2022-07-29 UTC+2

التحليل الفني لزوج اليورو/الدولار الأمريكي ليوم 29 يوليو 2022

توقعات السوق الفنية: لا تزال الموجة C من تصحيح ABC الشامل قيد التقدم وكان قرار سعر الفائدة الفيدرالي بمثابة حافز لتحرك السوق لأعلى. الهدف المحتمل للموجة C يقع عند المستوى

Sebastian Seliga 11:13 2022-07-29 UTC+2

توقعات زوج اليورو/الدولار الأمريكي ليوم 29 يوليو 2022

فشلت محاولة الأمس لاختراق الدعم 1.0150. بعد أن شهد السعر انخفاضا قدره 83 نقطة، ارتد السعر وأغلق اليوم عند مستوى الافتتاح. في هذا الوقت ، وصل خط إشارة مذبذب مارلين

Laurie Bailey 08:06 2022-07-29 UTC+2

توقعات زوج الجنيه الإسترليني/الدولار الأمريكي ليوم 29 يوليو 2022

يواصل الجنيه البريطاني ارتفاعه نحو المستوى المستهدف الأقرب 1.2230. يوفر خط مؤشر التوازن المقاومة على الرسم البياني اليومي. إذا تمكن السعر من التغلب على هذه المقاومة ، واستقر فوق 1.2230

Laurie Bailey 07:33 2022-07-29 UTC+2
لا تستطيع التحدث الآن؟
اطرح سؤالك في الدردشة.