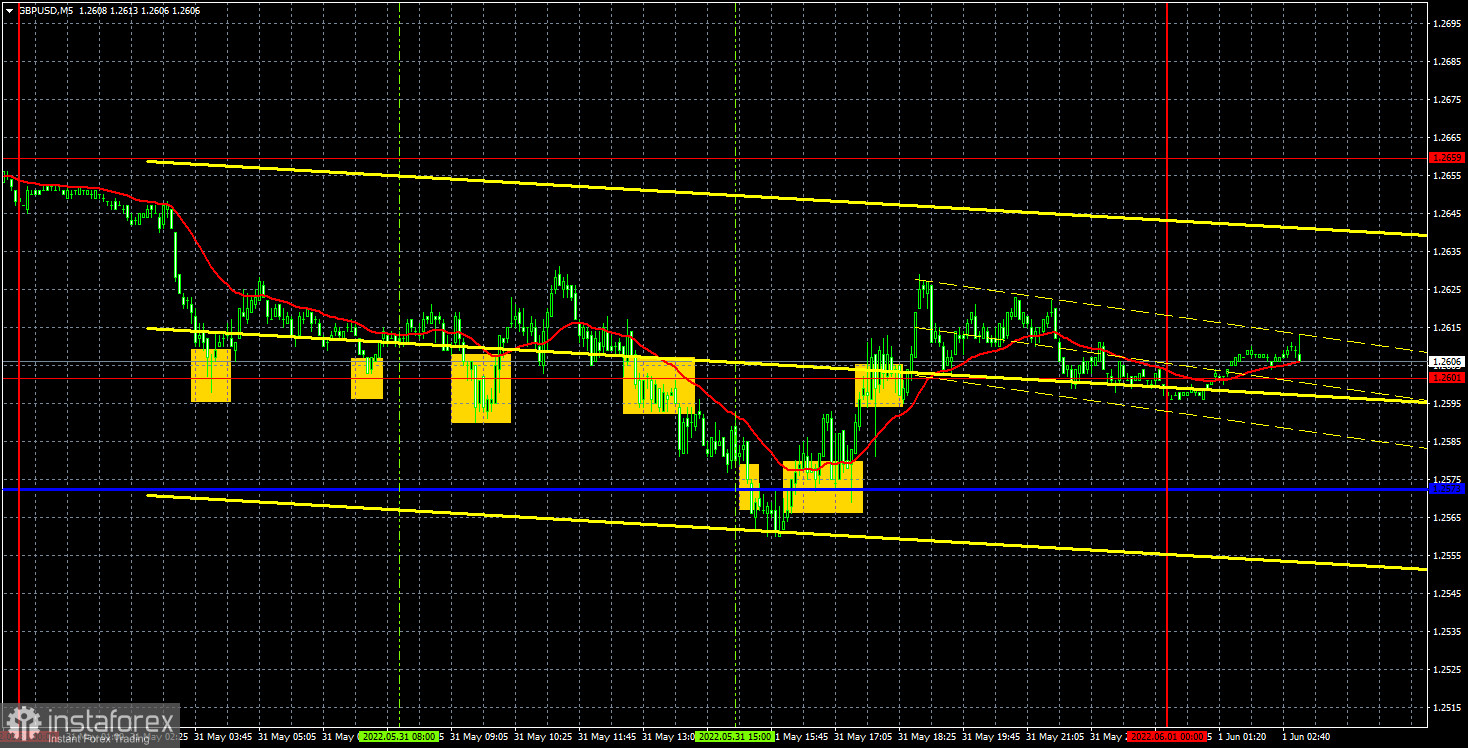
GBP/USD 5M
The GBP/USD currency pair also overcame the trend line on Tuesday, which was also approaching in the last few days. The euro and the pound as a whole have been trading almost identically in recent weeks, which leads to the conclusion that the US dollar's influence has a priority on the movement of both currency pairs. In other words, factors related to the US currency are more important than those related to the euro and the pound. Even the banal desire at this time or the unwillingness of the market to buy or sell the dollar matters more than macroeconomic statistics from the European Union or the UK. Moreover, there is little good news from these places now. This week there will be practically no news from Great Britain, and from the EU they come in a harmonious stream and almost all of them are negative. Thus, both pairs can continue to move identically. But the pound failed to settle below the critical line, so we believe that the upward trend continues. Consolidating below Kijun-sen can be considered the market's readiness for new short positions on the British currency.
There were many trading signals on Tuesday, but the movement itself left much to be desired. Almost all signals of the day were formed near the extreme level of 1.2601, and this, we recall, is a sign of a flat. The first three buy signals were almost identical to each other - rebounds from the level of 1.2601. However, the most that the pair has moved is 20 points up, which was enough to set Stop Loss to breakeven. This was followed by a signal to sell, which did not bring traders any profit, since the deal should have been closed at the same level as it was opened (when the pair settled back above the critical line). The last two signals should not have been worked out. The volatility of the day amounted to almost 100 points, but, to be honest, it was practically not noticeable that the pair was moving actively.
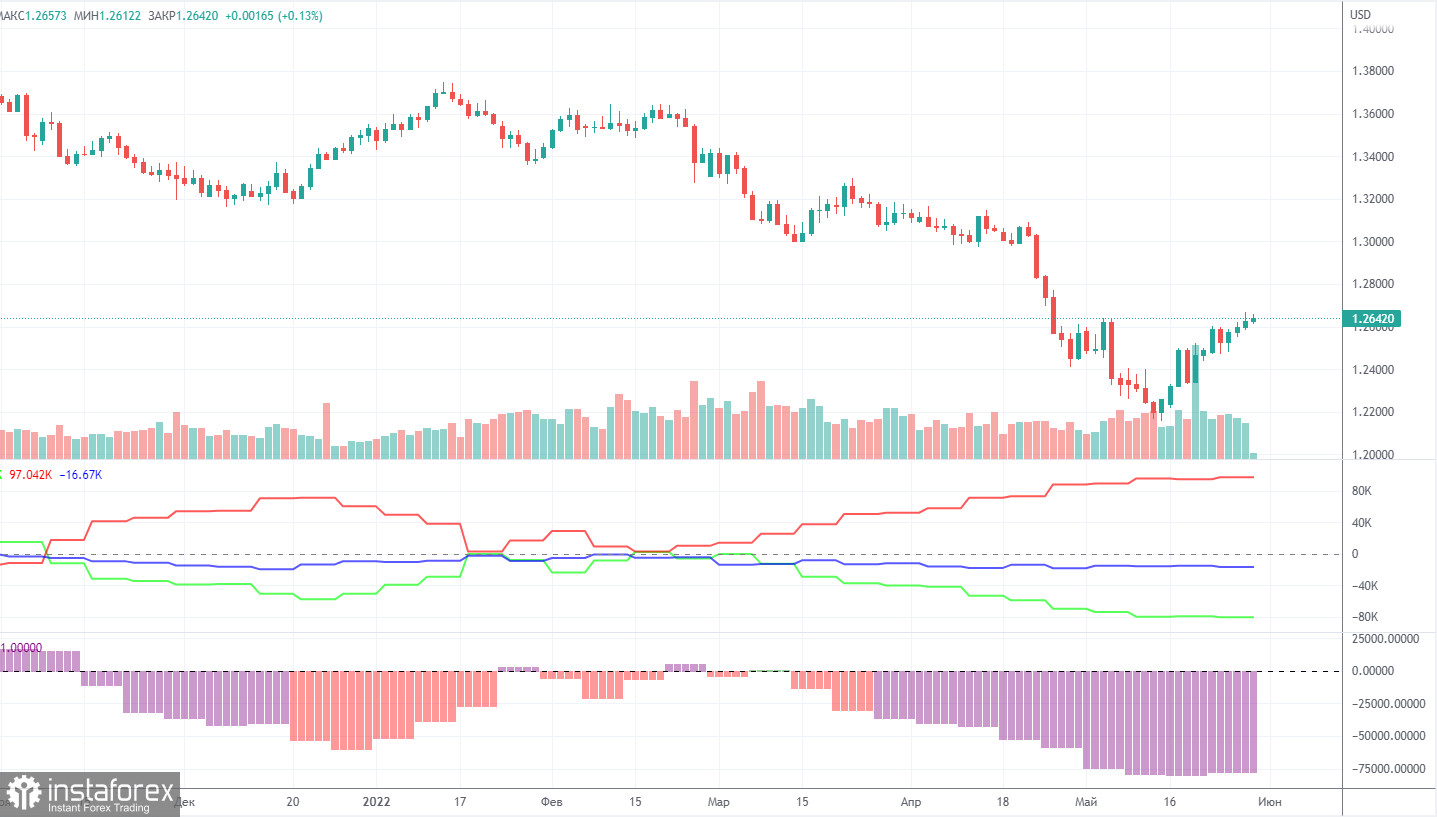
COT report:
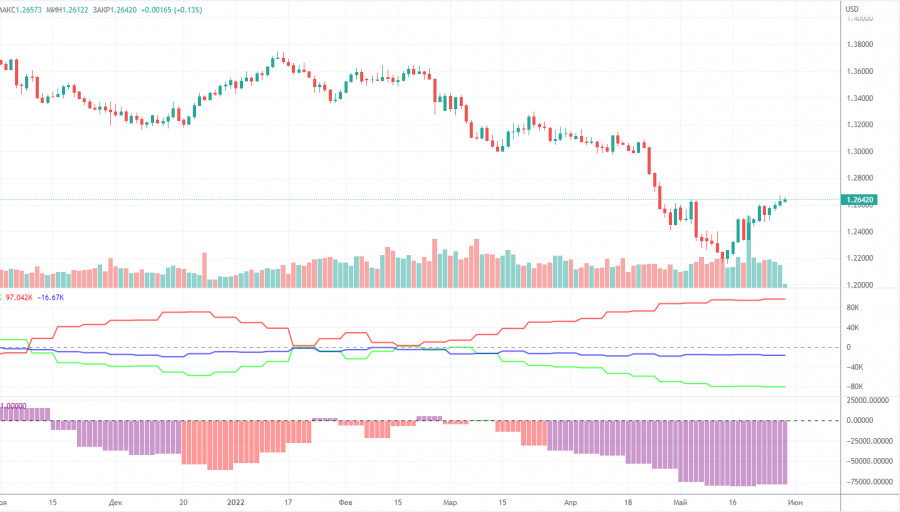
The latest Commitment of Traders (COT) report on the British pound showed almost no change. During the week, the non-commercial group closed 700 long positions and opened 500 shorts. Thus, the net position of non-commercial traders decreased by only 1,200. The net position has been falling for three months already, which is perfectly visualized by the green line of the first indicator in the chart above or the histogram of the second indicator. The non-commercial group has already opened a total of 106,000 shorts and only 26,000 longs. Thus, the difference between these numbers is already more than four times. This means that the mood among professional traders is now "pronounced bearish". Note that in the case of the pound, the COT report data very accurately reflects what is happening in the market: the mood of traders is "very bearish", and the pound has been falling against the US dollar for a very long time. In the last two weeks, the pound has started rising, but even in the chart for this paragraph (daily timeframe), this movement looks very weak so far. Since in the case of the pound, the COT report data reflects the real picture of things, we note that a strong divergence of the red and green lines of the first indicator often means the end of the trend. Therefore, now you can really count on a new upward trend. And since the euro and the pound are very often traded in the same way, you can count on an upward trend for the euro. Of course, if the geopolitics or the foundation does not continue to deteriorate.
We recommend to familiarize yourself with:
Overview of the EUR/USD pair. June 1. The sixth package of sanctions from the EU against Russia has been agreed after all.
Overview of the GBP/USD pair. June 1. The problem of the "Northern Ireland Protocol" is becoming more acute.
Forecast and trading signals for EUR/USD on June 1. Detailed analysis of the movement of the pair and trading transactions.
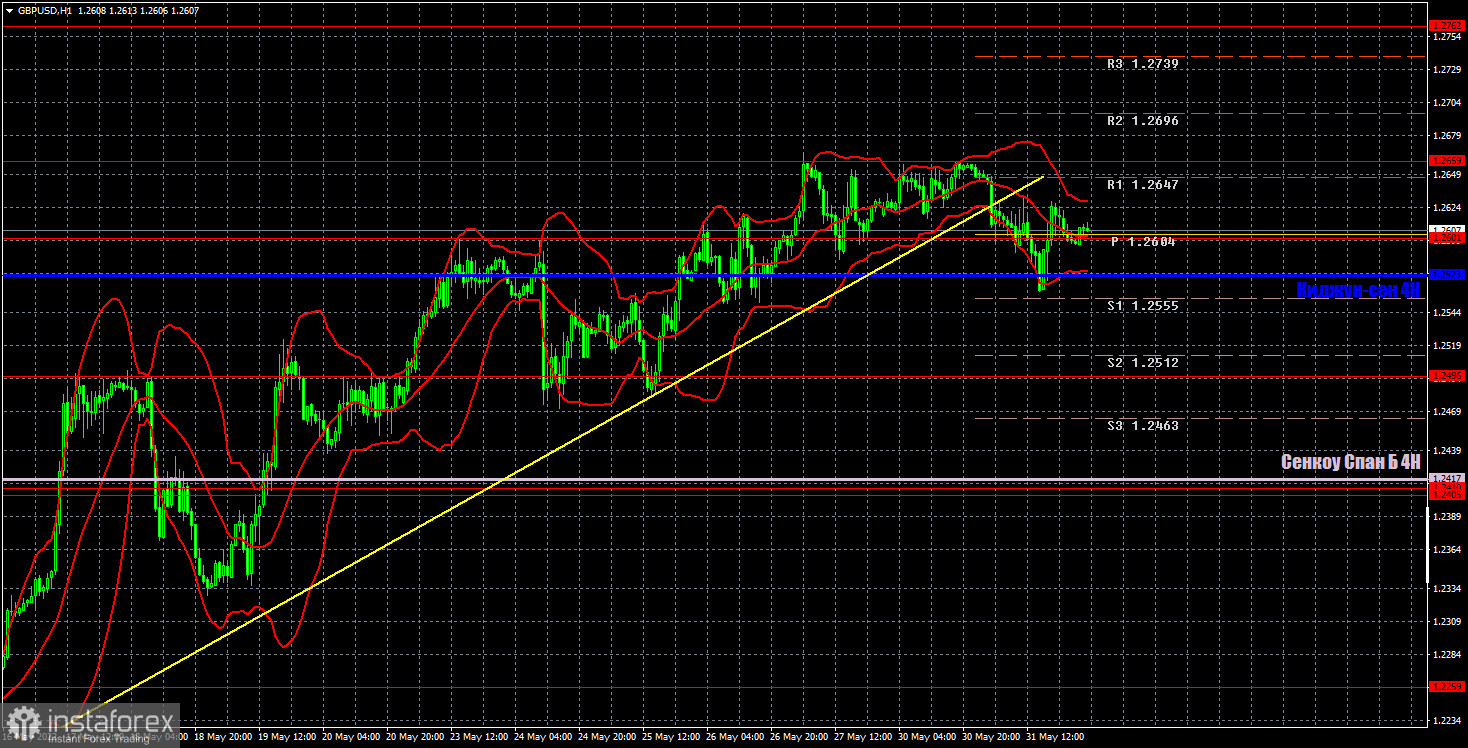
GBP/USD 1H
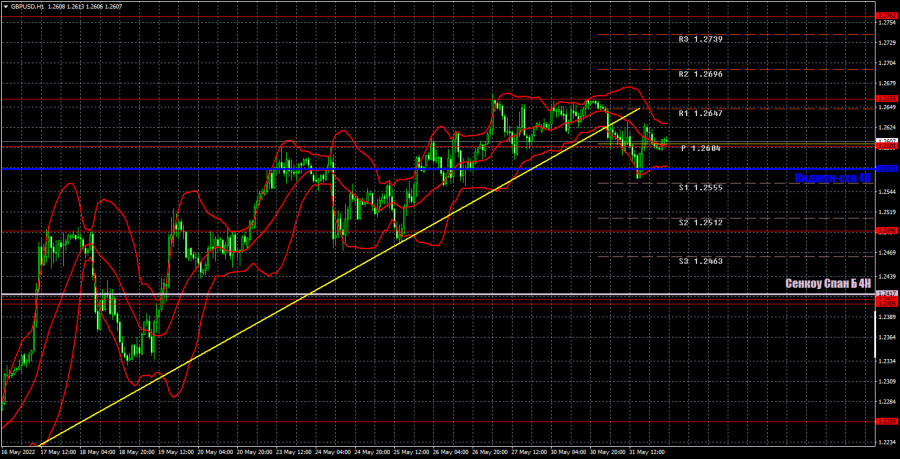
The pair has settled below the trend line on the hourly timeframe, so now the trend has formally changed to a downward trend. We expect the pound to continue to strengthen in the coming weeks, but now the movements can be very "ragged" or "fluctuating". At this time, we recommend not to rush to sell. It is better to wait for a consolidation below the critical line, and only after that it will be possible to expect a fall to the Senkou Span B line. The first attempt to overcome this line was unsuccessful. Today we highlight the following important levels: 1.2259, 1.2405-1.2410, 1.2496, 1.2601, 1.2659, 1.2762. Senkou Span B (1.2417) and Kijun-sen (1.2573) lines can also be sources of signals. Signals can be "rebounds" and "breakthroughs" of these levels and lines. The Stop Loss level is recommended to be set to breakeven when the price passes in the right direction by 20 points. Ichimoku indicator lines can move during the day, which should be taken into account when determining trading signals. The chart also contains support and resistance levels that can be used to take profits on trades. Reports on business activity in the industrial sectors are scheduled for Wednesday in the UK and the US. On the other hand, the ADP report on the number of employees in the private sector will also be released in the US. In general, all these reports are not important, so the reaction to them can follow only if the actual values differ greatly from the forecast.
Explanations for the chart:
Support and Resistance Levels are the levels that serve as targets when buying or selling the pair. You can place Take Profit near these levels.
Kijun-sen and Senkou Span B lines are lines of the Ichimoku indicator transferred to the hourly timeframe from the 4-hour one.
Support and resistance areas are areas from which the price has repeatedly rebounded off.
Yellow lines are trend lines, trend channels and any other technical patterns.
Indicator 1 on the COT charts is the size of the net position of each category of traders.
Indicator 2 on the COT charts is the size of the net position for the non-commercial group.