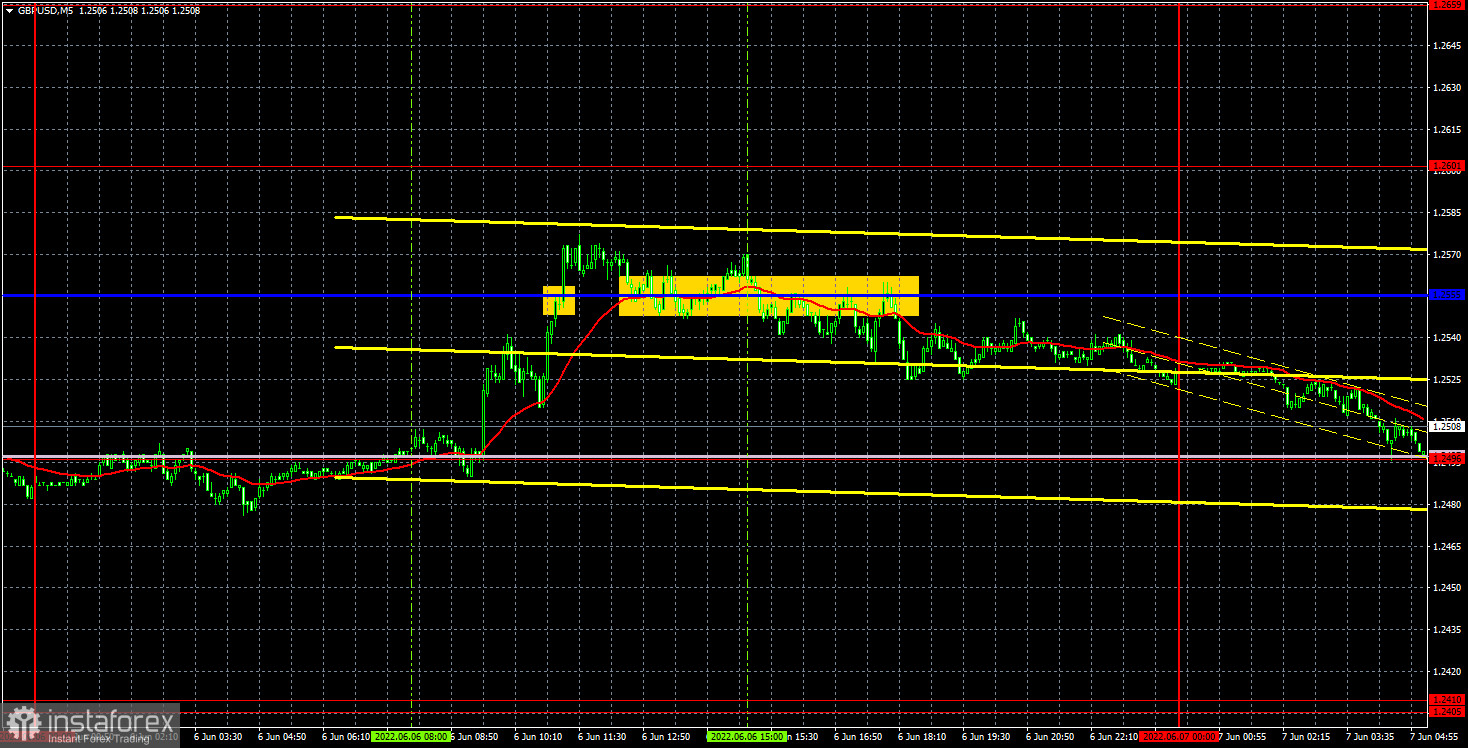
GBP/USD 5M
The GBP/USD currency pair showed very interesting movements on Monday. First, the quotes of the British pound rose by 100 points for no reason at all, and then the reverse movement began, which at the moment is almost the same 100 points. Well, if you immediately look at the hourly timeframe, it becomes clear that the pair has started trading in the "swing" mode, which we warned about in recent articles. This mode means that at this time the market cannot decide in which direction to trade the pair. However, the movements themselves are far from "flat", since the volatility of each day is at least 100 points. Thus, it is possible to trade even in the "swing" mode, but, of course, it is much more risky than in a normal trend. In the chart below, we can clearly see how the price has already overcome the Senkou Span B and Kijun-sen lines several times, and the Ichimoku indicator lines are generally considered strong. No important reports were published in the UK and the US yesterday, but, as we can see, the pair traded well even without statistics.
As for trading signals, there were only two of them on Monday. Moreover, it is very difficult to characterize the second one in any way, since the price simply moved along the critical line for several hours. But let's start with the first buy signal near the same Kijun-sen line. It turned out to be false, and the pair could not go up even 10 points after its formation. The second signal was formally for short positions, but it was extremely difficult to identify it, since the price "danced" in a limited range for a long time, so there could be errors here. One way or another, even if traders opened a short position, it was clearly not possible to get a big profit on it, since the price went down another 20 points and returned to the critical line twice. In general, the first trading day of the week turned out to be unsuccessful in terms of trading, although the movements of the pair look quite good on the hourly timeframe...
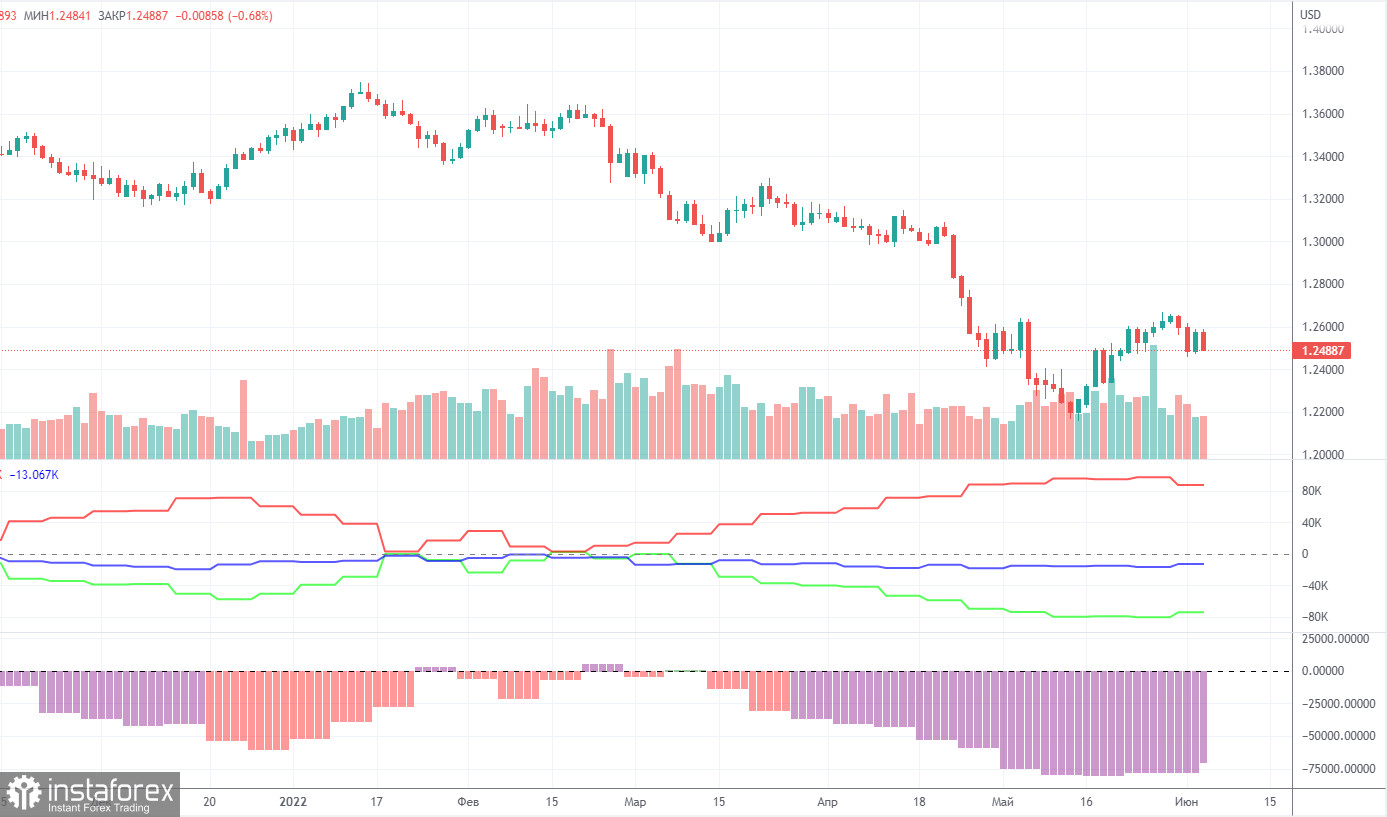
COT report:
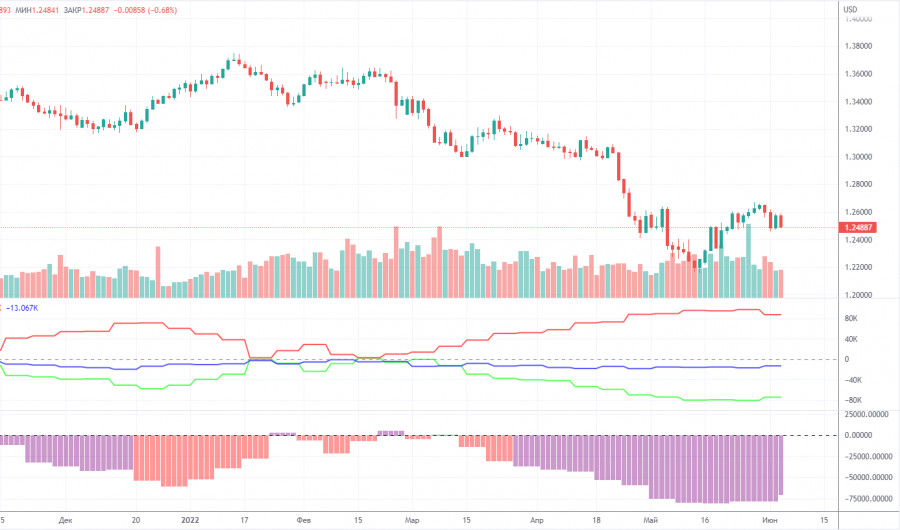
The latest Commitment of Traders (COT) report on the British pound showed minimal changes. During the week, the non-commercial group opened 4,800 long positions and closed 1,400 short positions. Thus, the net position of non-commercial traders increased by 6,200, for the first time in a long time. The net position has been falling for three months, which is perfectly visualized by the green line of the first indicator in the chart above or the histogram of the second indicator. Therefore, one increase in this indicator is unlikely to unambiguously indicate the end of the downward trend for the pound. The non-commercial group has already opened a total of 105,000 shorts and only 31,000 longs. Thus, the difference between these numbers is already more than three times. This means that the mood among professional traders now remains "pronounced bearish". We note that in the case of the pound, the COT report data very accurately reflects what is happening in the market: the mood of traders is "very bearish", and the pound has been falling against the US dollar for a long time. In the past few weeks, the pound has shown growth, but even in the chart for this paragraph (daily timeframe), this movement looks very weak. Since in the case of the pound, the COT report data reflects the real picture of things, we note that a strong divergence of the red and green lines of the first indicator often means the end of the trend. Therefore, formally now we can count on a new upward trend. However, weak geopolitical, fundamental and macroeconomic backgrounds for European currencies may again put pressure on these currencies.
We recommend to familiarize yourself with:
Overview of the EUR/USD pair. June 7. Turkey plays on two fronts and only worsens the geopolitical situation in the world.
Overview of the GBP/USD pair. June 7. Is it time for Boris Johnson?
Forecast and trading signals for EUR/USD on June 7. Detailed analysis of the movement of the pair and trading transactions.
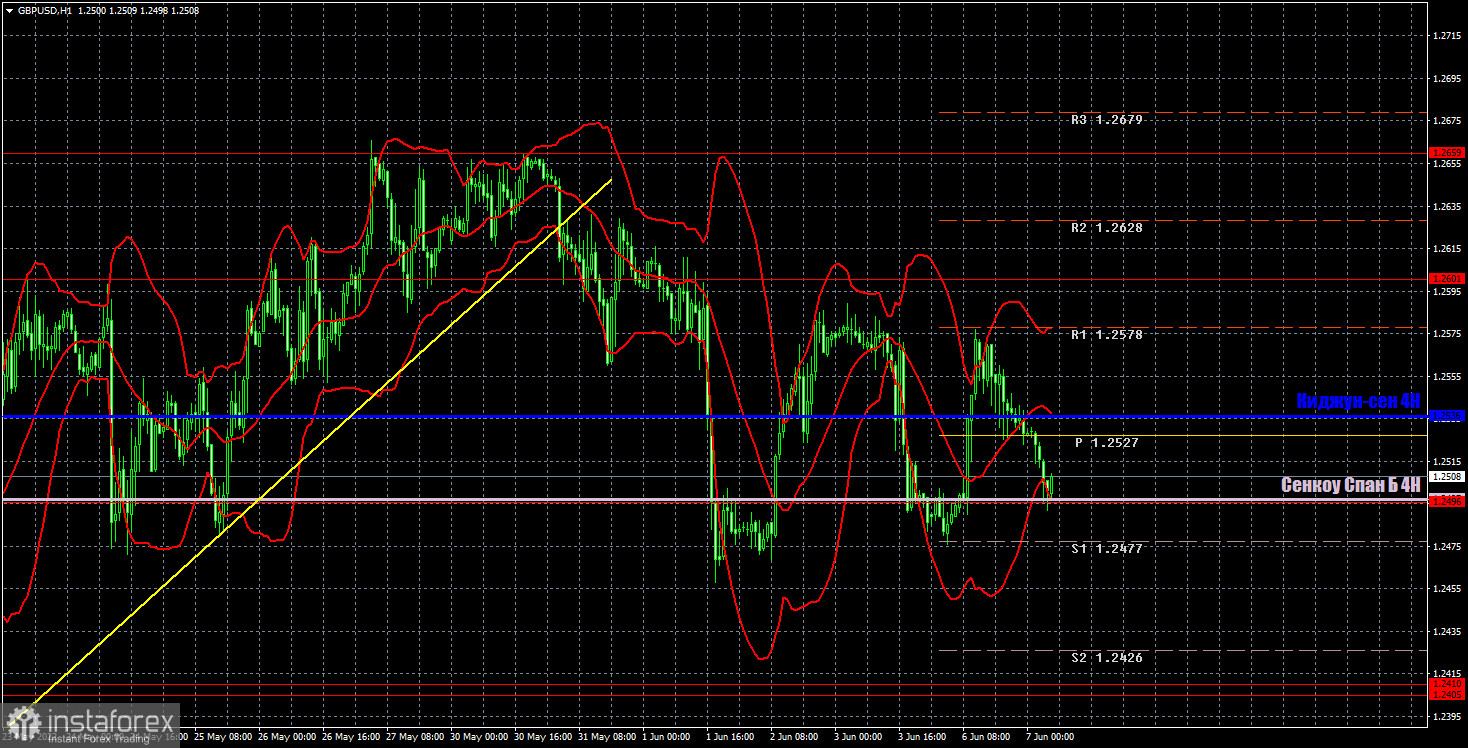
GBP/USD 1H
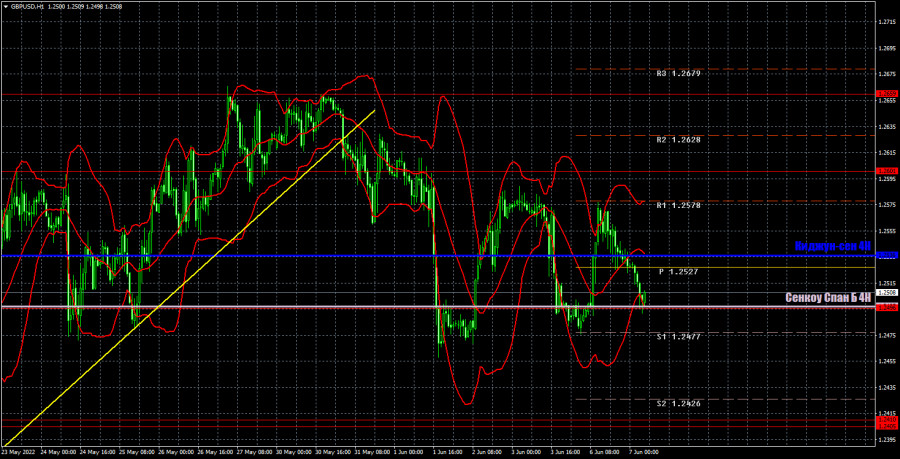
The pair is woefully kept from falling below the Senkou Span B line on the hourly timeframe. To be more precise, the price has already begun to ignore the Ichimoku indicator lines, which does not mean anything good. We believe that this behavior of the pair indicates a possible "flat" or "swing". And no matter how attractive these movements look on the hourly timeframe, they still lead to forming false signals on the 5-minute timeframe. Today, we highlight the following important levels: 1.2259, 1.2405-1.2410, 1.2496, 1.2601, 1.2659. Senkou Span B (1.2497) and Kijun-sen (1.2536) lines can also be sources of signals. Signals can be "rebounds" and "breakthroughs" of these levels and lines. The Stop Loss level is recommended to be set to breakeven when the price passes in the right direction by 20 points. Ichimoku indicator lines can move during the day, which should be taken into account when determining trading signals. The chart also contains support and resistance levels that can be used to take profits on trades. There are no major events or publications scheduled for Tuesday in the UK and US. However, the pair may show good volatility. According to the logic of things, today we should see a new round of upward movement and the critical line being ignored.
Explanations for the chart:
Support and Resistance Levels are the levels that serve as targets when buying or selling the pair. You can place Take Profit near these levels.
Kijun-sen and Senkou Span B lines are lines of the Ichimoku indicator transferred to the hourly timeframe from the 4-hour one.
Support and resistance areas are areas from which the price has repeatedly rebounded off.
Yellow lines are trend lines, trend channels and any other technical patterns.
Indicator 1 on the COT charts is the size of the net position of each category of traders.
Indicator 2 on the COT charts is the size of the net position for the non-commercial group.