EUR/USD 5M
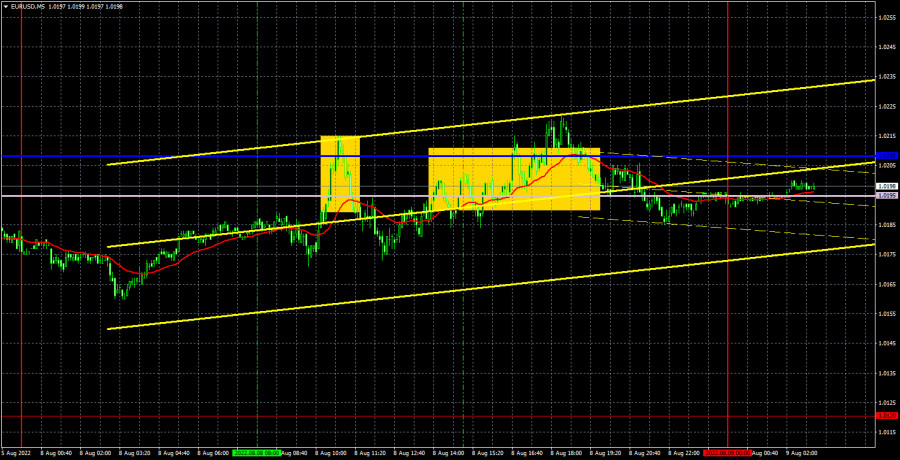
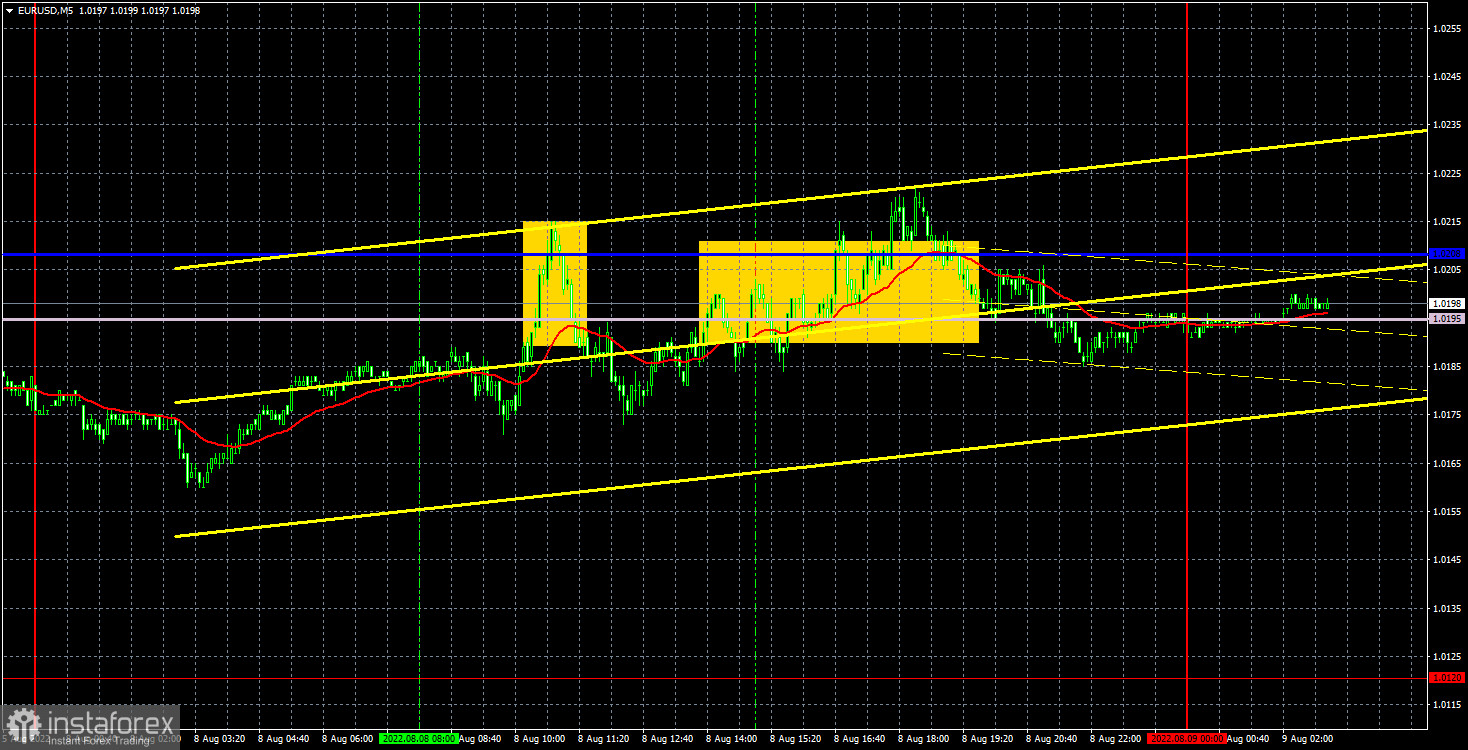
The EUR/USD pair was already correcting upwards on Monday. Although all the concepts of trend and correction at this time are absolutely not true, since the pair has been flat for about a month. The euro is traded strictly between the levels of 1.0120 and 1.0269, and now it is also strictly in the middle of the horizontal channel. Exactly where the Kijun-sen and Senkou Span B lines lie at the present time, which have lost their strength and clearly indicate a flat, in addition to all other technical signals. Therefore, it is simply impossible to say anything new about the technical picture at this time. The situation on Monday did not change, and it did not have much chance of any changes. No macroeconomic statistics published either in the US or in the European Union on Monday, and there were no important fundamental events either. It remains only to remind traders that the next important report is inflation in the US on Wednesday, and that the pair may leave the horizontal channel unexpectedly.
Traders had several opportunities to open trades on Monday. However, look at the quality of the trading signals that have formed throughout the day. By the way, it should also be taken into account that the volatility amounted to just over 60 points, which is very low in the current conditions. The Kijun-sen and Senkou Span B lines should have been considered as an area, and it turns out that the first signal was a price rebound from this area. And after this signal, which lasted for two hours, the price could not go down even 15 points. Therefore, we believe that a short position should have been closed at the first convenient opportunity (if you opened it at all) and not entered the market again.
COT report:
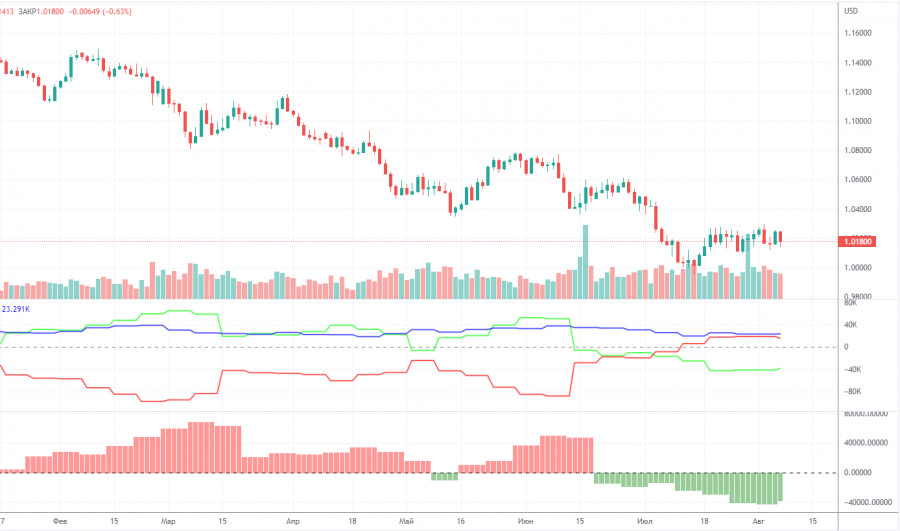
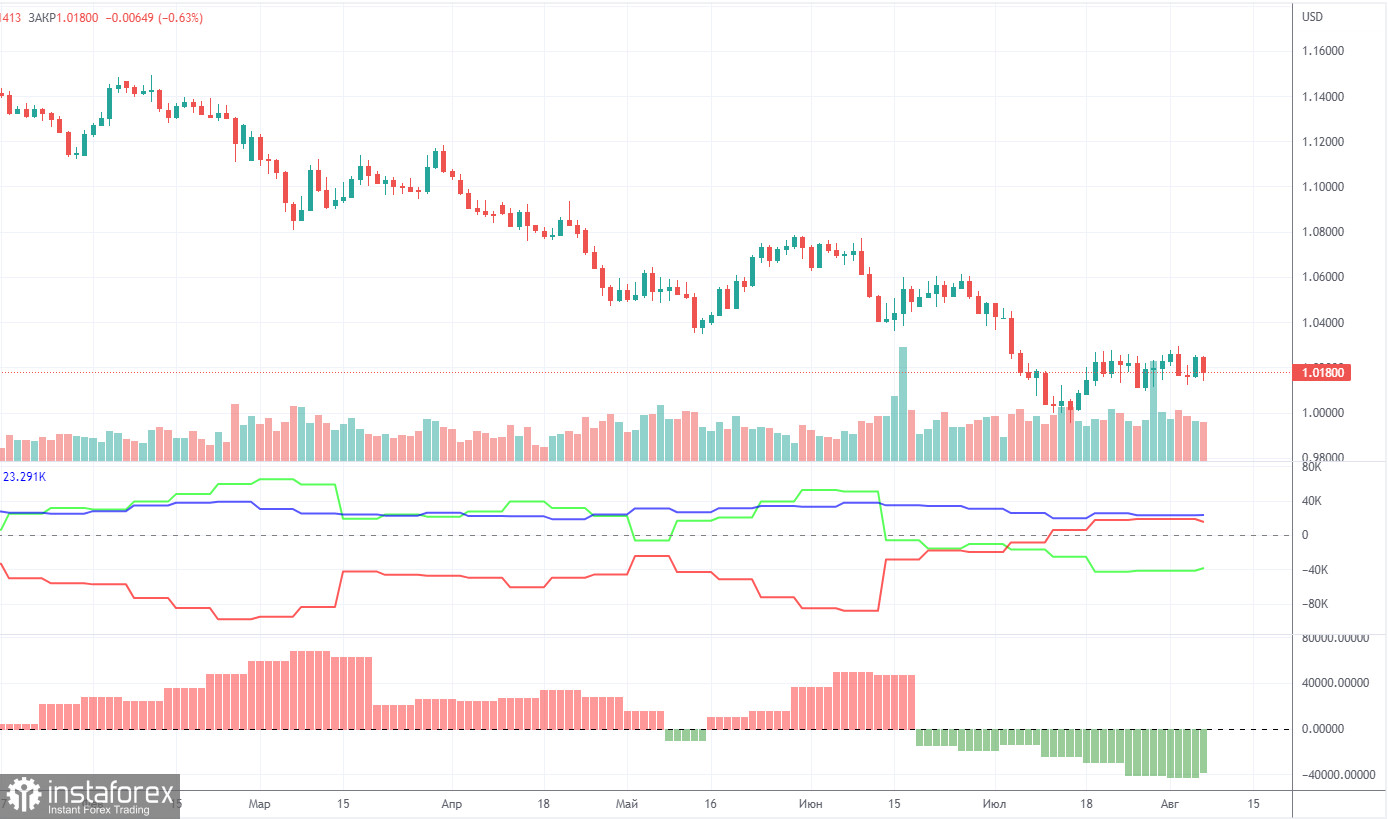
The Commitment of Traders (COT) reports on the euro over the past six months have raised a huge number of questions. The chart above clearly shows that for most of 2022 they showed an open bullish mood of professional players, but at the same time, the euro was falling at the same time. At this time, the situation has changed, but NOT in favor of the euro. If earlier the mood was bullish, and the euro was falling, now the mood is bearish and... the euro is also falling. Therefore, for the time being, we do not see any grounds for the euro's growth, because the vast majority of factors remain against it. During the reporting week, the number of long positions decreased by 6,300, while the number of shorts in the non-commercial group decreased by 9,100. Accordingly, the net position increased by about 3,000 contracts, which is a meager change. The mood of the big players remains bearish and has steadily intensified in recent weeks. From our point of view, this fact very eloquently indicates that at this time even commercial traders do not believe in the euro. The number of longs is lower than the number of shorts for non-commercial traders by 39,000. Therefore, we can state that not only the demand for the US dollar remains high, but also the demand for the euro is quite low. This may lead to a new, even greater fall of the euro. Over the past six months or a year, the euro has not been able to show even a tangible correction, not to mention something more. The highest upward movement was about 400 points. Over the past three weeks, the pair has managed to correct by 300 points.
We recommend to familiarize yourself with:
Overview of the EUR/USD pair. August 9. The Fed rate... There are no other topics on the currency market right now.
Overview of the GBP/USD pair. August 9. The Bank of England was pessimistic last week, but maybe it was optimistic?
Forecast and trading signals for GBP/USD on August 9. Detailed analysis of the movement of the pair and trading transactions.
EUR/USD 1H
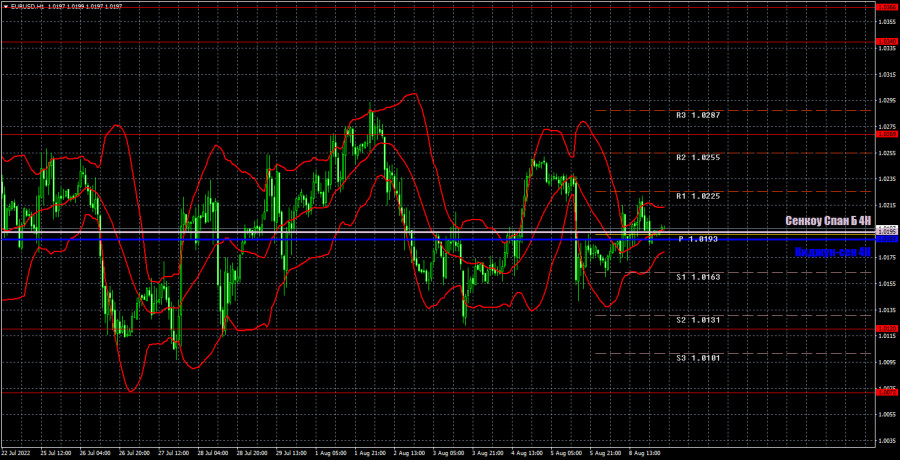
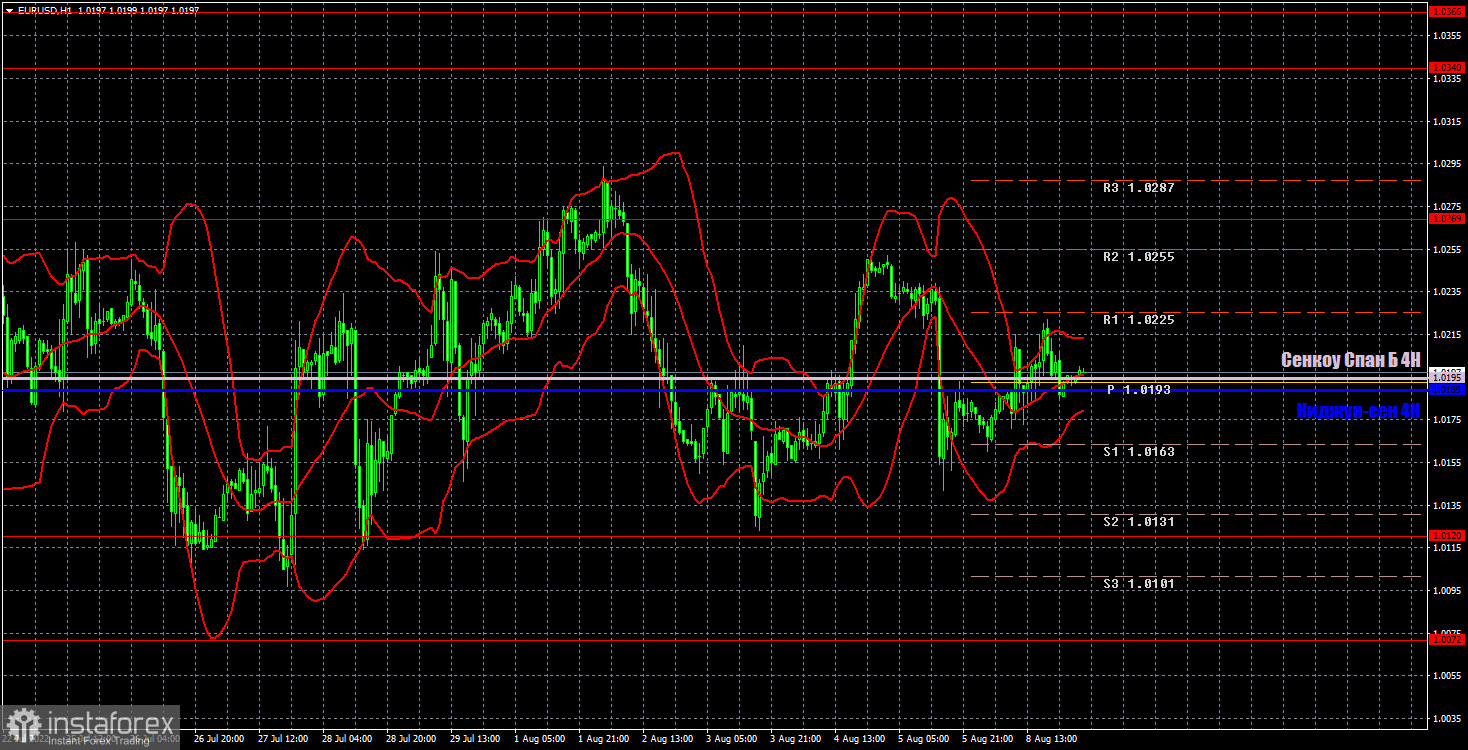
The pair continues to trade between the levels of 1.0120 and 1.0269 on the hourly timeframe. Thus, the flat is preserved. The lines of the Ichimoku indicator are currently very weak and no strong signals are being formed around them. Therefore, traders need to make a decision whether they want to trade the pair in an open flat? We highlight the following levels for trading on Tuesday - 1.0000, 1.0072, 1.0120, 1.0269, 1.0340-1.0366, 1.0485, as well as Senkou Span B (1.0189) and Kijun-sen lines (1.0195). Ichimoku indicator lines can move during the day, which should be taken into account when determining trading signals. There are also secondary support and resistance levels, but no signals are formed near them. Signals can be "rebounds" and "breakthrough" extreme levels and lines. Do not forget about placing a Stop Loss order at breakeven if the price has gone in the right direction for 15 points. This will protect you against possible losses if the signal turns out to be false. No important publication or fundamental event planned in the European Union and the US on August 9. Traders will again have nothing to react to during the day. However, the pair may continue to move quite volatilely within the horizontal channel.
Explanations for the chart:
Support and Resistance Levels are the levels that serve as targets when buying or selling the pair. You can place Take Profit near these levels.
Kijun-sen and Senkou Span B lines are lines of the Ichimoku indicator transferred to the hourly timeframe from the 4-hour one.
Support and resistance areas are areas from which the price has repeatedly rebounded off.
Yellow lines are trend lines, trend channels and any other technical patterns.
Indicator 1 on the COT charts is the size of the net position of each category of traders.
Indicator 2 on the COT charts is the size of the net position for the non-commercial group.