Details of the economic calendar for September 30
The final data on UK GDP for the second quarter brought a pleasant surprise. GDP for the second quarter grew by 0.2% compared to the previous forecast of -0.1%, and in annual terms increased to +4.4% against the previous estimate of 2.9%.
Surprisingly, Britain is not in a technical recession based on GDP data.
The publication of data on Eurozone inflation was considered the main event, which reached a double-digit record. Eurozone consumer prices rose by 10% in September, a new all-time high, according to the European Union Statistical Office.
The reason for such unprecedented performance lies in the sharp rise in energy prices.
As inflation rises, the ECB will continue to tighten monetary policy, which will lead to a sustained rise in interest rates.
Analysis of trading charts from September 30
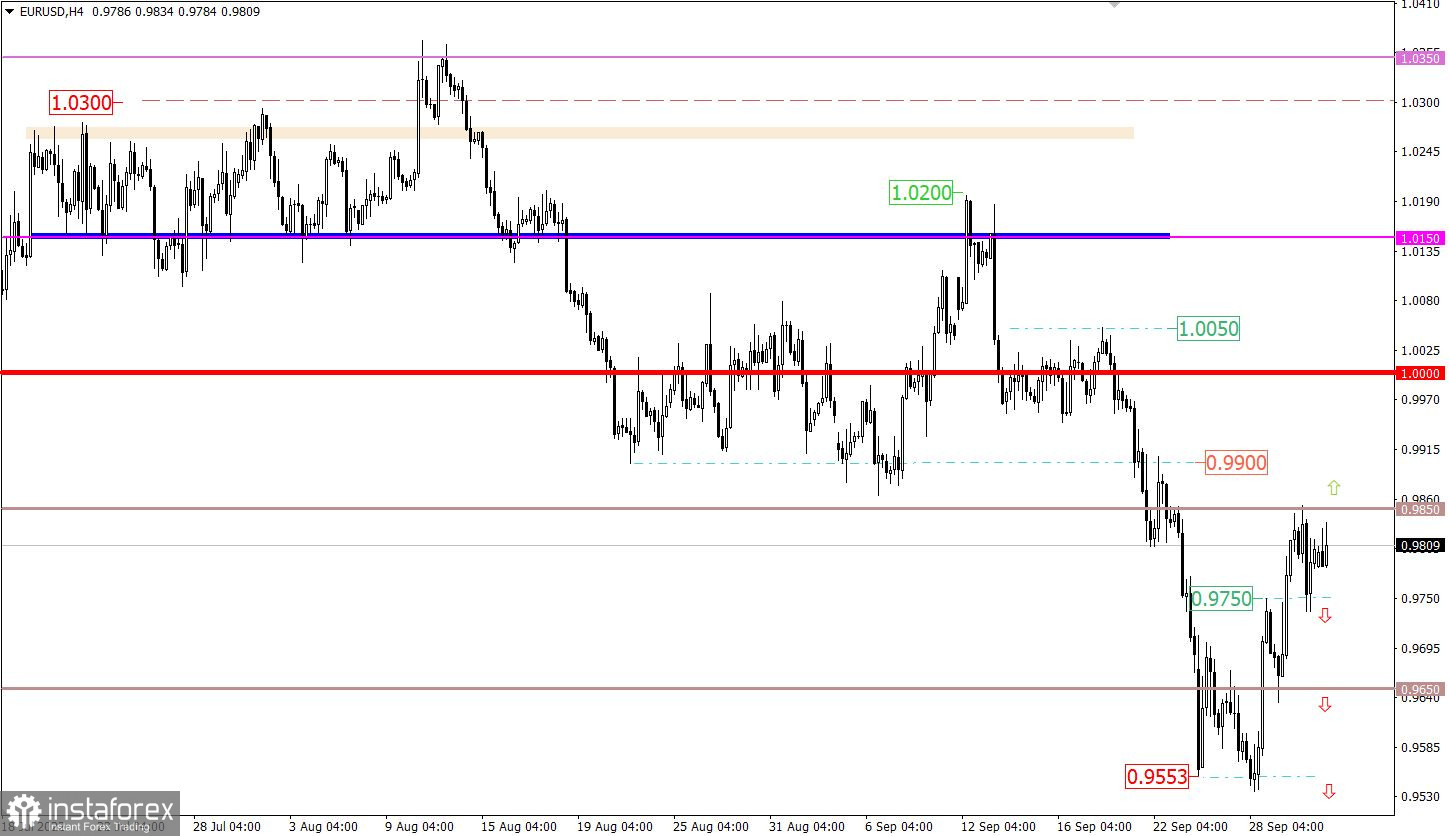
The EURUSD currency pair, during the corrective movement, reached the resistance level of 0.9850, relative to which there was a reduction in the volume of long positions on the euro. As a result, there was a price rebound in the market.
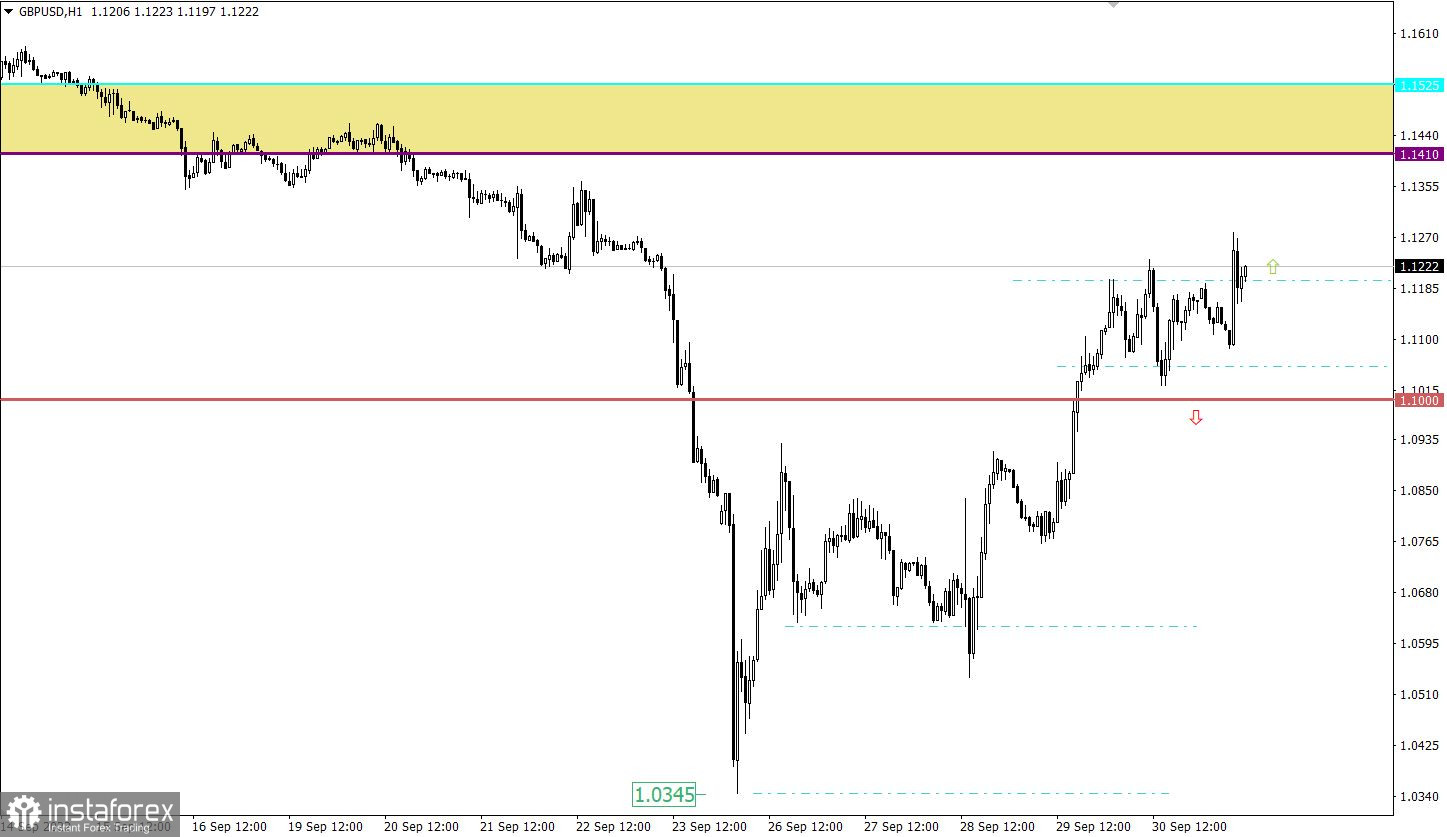
The GBPUSD currency pair ended last week in the stage of lateral amplitude, while the price range was quite wide, about 200 points.
Economic calendar for October 3
Today, data on the business activity index in the manufacturing sector in Europe and the UK have already been published, where the indicators came out worse than the preliminary estimate.
Details:
Eurozone manufacturing PMI fell from 49.6 to 48.4 in September.
UK's manufacturing PMI in September rose from 47.3 to 48.4 against the forecast of 48.5.
There was practically no reaction due to the fact that the market played out the information noise.
During the American trading session, the United States manufacturing PMI is also expected for publication, which may rise from 51.5 to 51.8.
As for the information flow, the Fed will hold a closed meeting. Expect news from the media regarding what the board of governors discussed.
Time targeting:
US Manufacturing PMI (Sept.) – 13:45 UTC
Trading plan for EUR/USD on October 3
To prolong the current correction on the market, the quote must be kept above the resistance level for at least a four-hour period. In this case, buyers of the euro will have high chances to return the quote to the parity area.
An alternative scenario considers the completion of a corrective move, where holding the price below 0.9750 in a four-hour period could lead to a phased decline.
Trading plan for GBP/USD on October 3
Since the opening of the new trading week, the sideways formation has been broken in an upward trajectory. The movement was accompanied by high speculative interest, during which there was inertia on a scale of more than 180 points.
The reason for such a heavy movement was the rumor that the UK plans to cancel the plan to reduce the tax rate from 45% to 40%. Subsequently, this rumor was officially confirmed by the British government.
UK Finance Minister Kwasi Kwarteng confirmed the change on Twitter.
"We get it, and we have listened," he wrote.
Returning to the technical analysis, a stable holding of the price above the high of the last week at 1.1233 may well lead to the subsequent strengthening of the pound towards the price range of 1.1410/1.1525.
Otherwise, the quote will continue to move within the previously passed amplitude of 1.1050/1.1200.
What is shown in the trading charts?
A candlestick chart view is graphical rectangles of white and black light, with sticks on top and bottom. When analyzing each candle in detail, you will see its characteristics of a relative period: the opening price, closing price, and maximum and minimum prices.
Horizontal levels are price coordinates, relative to which a stop or a price reversal may occur. These levels are called support and resistance in the market.
Circles and rectangles are highlighted examples where the price of the story unfolded. This color selection indicates horizontal lines that may put pressure on the quote in the future.
The up/down arrows are the reference points of the possible price direction in the future.