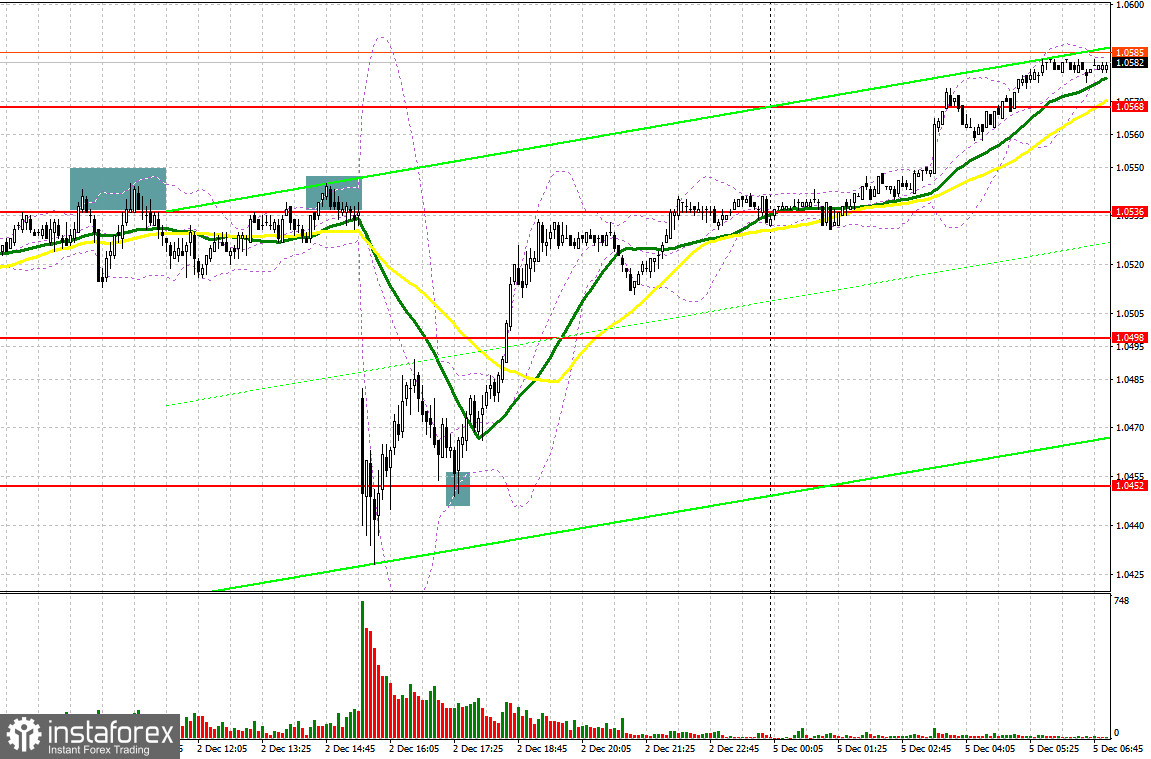
On Friday, the pair formed several good signals for entering the market. Let's see what happened on the 5-minute chart. In my previous review, I pointed out the level of 1.0536 and recommended entering the market from there. While rising toward this level, the pair formed several false breakouts, each serving as a sell signal. This resulted in the pair declining by 20 pips. Another false breakout at 1.0536 in the second half of the day before the US jobs data was released generated an additional sell signal which brought us 100 pips in profit. In the middle of the New York session, bulls managed to protect the level of 1.0452. Its retest created a good entry point for opening buy positions. So, the pair advanced by another 80 pips.
For long positions on EUR/USD:
Strong data from the US labor market provided some short-term support for the US dollar but after a while, the euro was back in demand. Meanwhile, large market players took advantage of the pair's correction and entered the market at a lower price. In the first half of the day, a weaker-than-expected report on services PMI in Germany and the eurozone, as well as the composite PMI, may put pressure on the euro. Indicators below 50 will signal that the EU economy is slipping into a recession. Besides, a steep fall in eurozone retail sales in October will add more pessimism to the market. If the euro declines in the first half of the day amid the downbeat macroeconomic data, only a false breakout at the nearest support of 1.0568 will form a buy signal. This will bring the price back to 1.0604 where the main trading activity will take place. A breakout of this range and its downward retest will create a good entry point to add more long positions, with a possible retest of the high at 1.0640. A further breakout at this point will trigger stop-loss orders set by the bears and generate an additional buy signal with an upside target at 1.0663 where I recommend profit taking. However, such an advance is possible only amid negative US data. If EUR/USD declines and bulls are idle at 1.0568, the pair will come under pressure which is still unlikely to scare off the euro bulls at the start of the week. A breakout at 1.0568 will send the price down to the next support level of 1.0532 where the moving averages limiting the downside potential of the pair are found. This level may form a lower boundary of the ascending channel. It will be reasonable to buy the pair at this level only after a false breakout. Going long on EUR/USD right after a rebound can be done at 1.0498 or 1.0452, bearing in mind a possible upside correction of 30-35 pips within the day.
For short positions on EUR/USD:
The euro sellers have done their best but the market has already started to shift toward bullish following Powell's comments about a possible slowdown in monetary tightening last week. As I've mentioned above, only negative data from the eurozone may support the euro bears. Their top priority today is to protect the level of 1.0604 and regain control of the support at 1.0568. A rise and a false breakout at 1.0604 will serve as a good signal to sell the pair. The downbeat data on the services PMI in the eurozone will exert more pressure on the euro. If so, the pair may break through the level of 1.0568 and then retest it, thus creating an additional sell signal with a possible correction toward 1.0532. Consolidation below this range will lead to a deeper downward correction to 1.0498 where I recommend profit taking. The level of 1.0452 will act as the lowest target. If tested by the price, it may challenge the bullish market but is unlikely to cancel it. In case EUR/USD advances in the European session and bears are idle at 1.0604, the price may surge to the level of 1.0640. It will be a good moment to go short on the pair but only after a failed attempt to settle there. Selling EUR/USD right after a rebound is recommended at the high of 1.0663, considering a possible downward correction of 30-35 pips within the day.
COT report
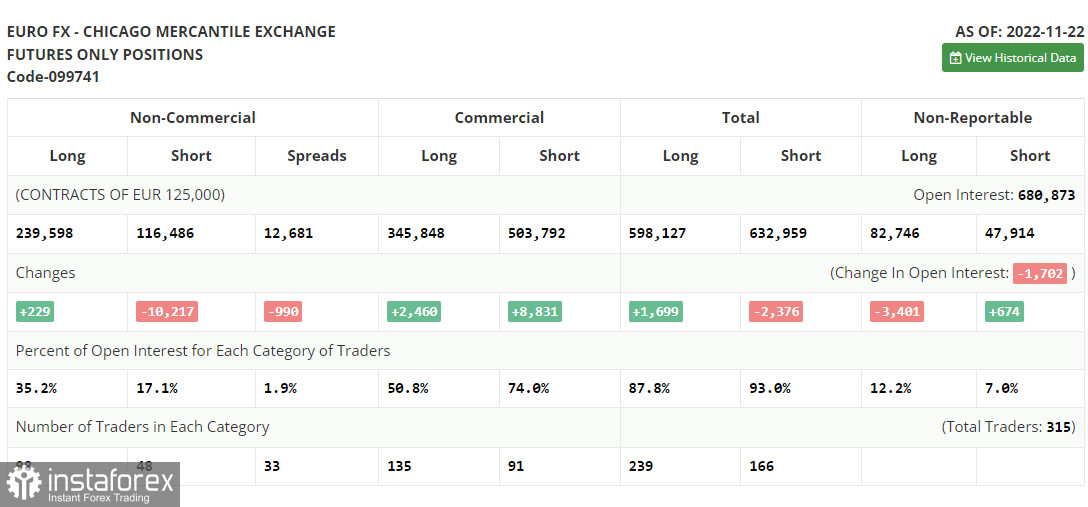
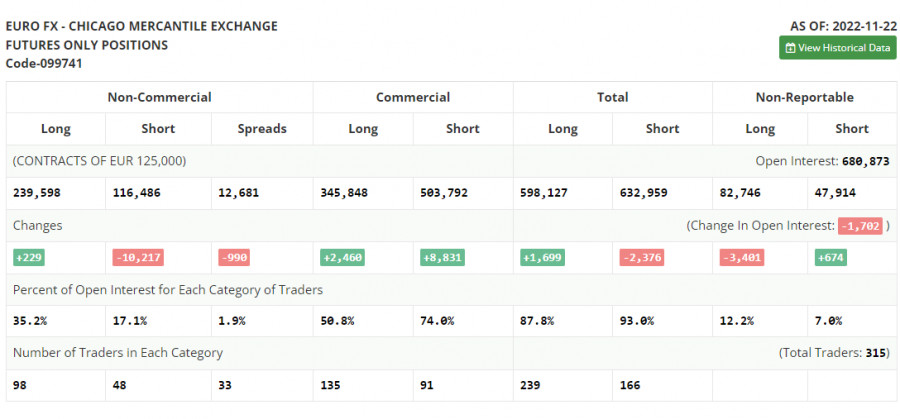
The Commitments of Traders report for November 22 recorded a rise in long positions and a sharp drop in short ones. The statement made by the Fed officials allowed bulls to gain ground in the market. It seems that traders hope that the US regulator will change its aggressive approach to monetary policy. The upcoming data on the US GDP and labor market will be a decisive factor to shape the sentiment of the market. The inflation report for November will complete the picture. A drop in the number of new jobs and a higher unemployment rate will weaken the position of the US dollar against risk assets, including the euro. Investors also need to carefully monitor statements made by Fed officials. If the stance of the US central bank becomes more hawkish, this will provoke more selling in the US dollar. The reason behind this is that the further rate hike will push the economy closer to a bigger recession. According to the COT report, long positions of the non-commercial group of traders rose by 229 to 239,598 while short positions dropped sharply by 10,217 to 116,486. Last week, the overall non-commercial net position increased to 123,112 from the previous reading of 112,666. This indicates that investors are taking advantage of a cheaper euro and continue to buy it even though it is holding above the parity level. They might also be accumulating long positions in hope that the pair will start to recover sooner or later. The weekly closing price declined to 1.0315 from 1.0390 a week ago.
Indicator signals:
Moving Averages
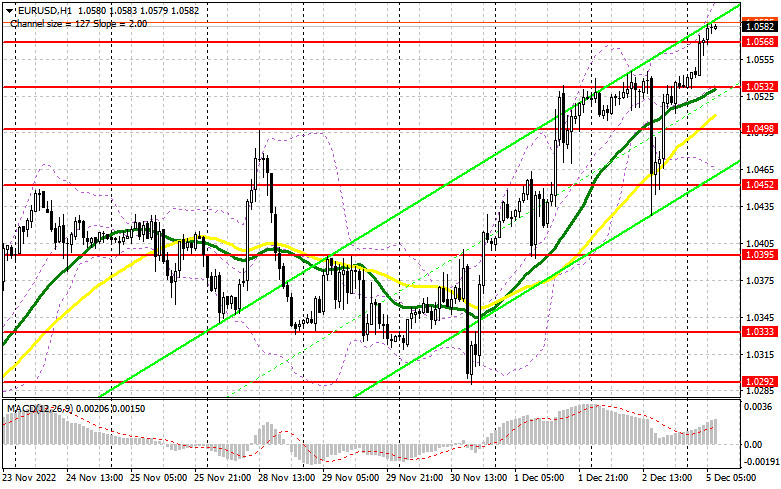
Trading above the 30- and 50-day moving averages indicates the dominance of the euro bulls.
Please note that the time period and levels of the moving averages are analyzed only for the H1 chart, which differs from the general definition of the classic daily moving averages on the D1 chart.
Bollinger Bands
If the pair advances, the upper band of the indicator at 1.0604 will act as resistance. In case of a decline, the lower band of the indicator at 1.0475 will serve as support.
Description of indicators:
• A moving average of a 50-day period determines the current trend by smoothing volatility and noise; marked in yellow on the chart;
• A moving average of a 30-day period determines the current trend by smoothing volatility and noise; marked in green on the chart;
• MACD Indicator (Moving Average Convergence/Divergence) Fast EMA with a 12-day period; Slow EMA with a 26-day period. SMA with a 9-day period;
• Bollinger Bands: 20-day period;
• Non-commercial traders are speculators such as individual traders, hedge funds, and large institutions who use the futures market for speculative purposes and meet certain requirements;
• Long non-commercial positions represent the total number of long positions opened by non-commercial traders;
• Short non-commercial positions represent the total number of short positions opened by non-commercial traders;
• The non-commercial net position is the difference between short and long positions of non-commercial traders.