Analyzing Thursday's trades:
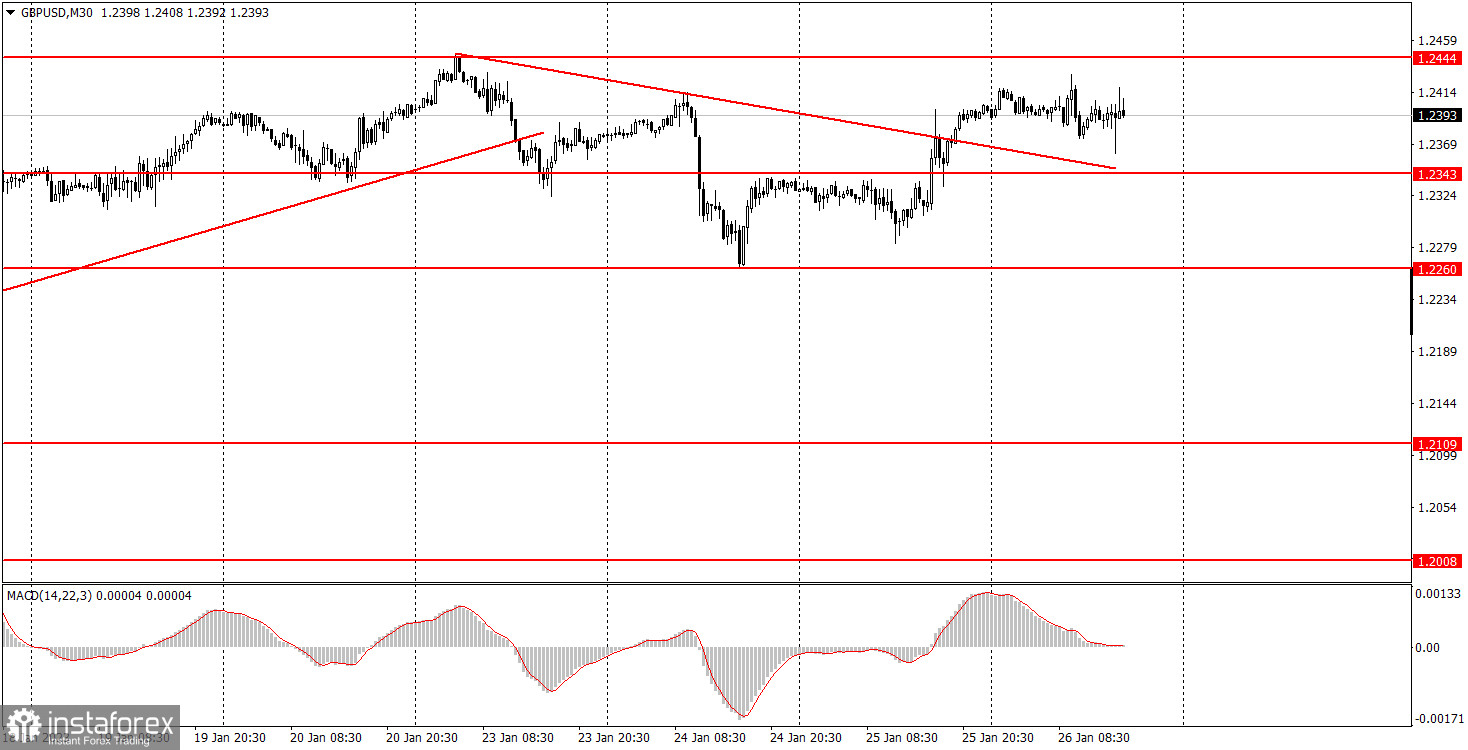
GBP/USD on 30M chart
GBP/USD edged up on Thursday and settled above the descending trend line, which we formed on Wednesday. Thus, the downtrend is broken one day after it was formed. Now the pound will either stay flat, or resume the upward movement. Do recall that important reports were just released in the US, and all of them were better than the forecasted ones. So we could have expected the pound to fall (growth of the USD), if the market would not ignore any data in favor of the US currency. Once again we saw the illogical reaction of the market. There were no important events in the UK. Not much important data on Friday. We are arriving at the finish line before the first central bank meetings in 2023. And the euro and the pound are approaching them in a great mood.
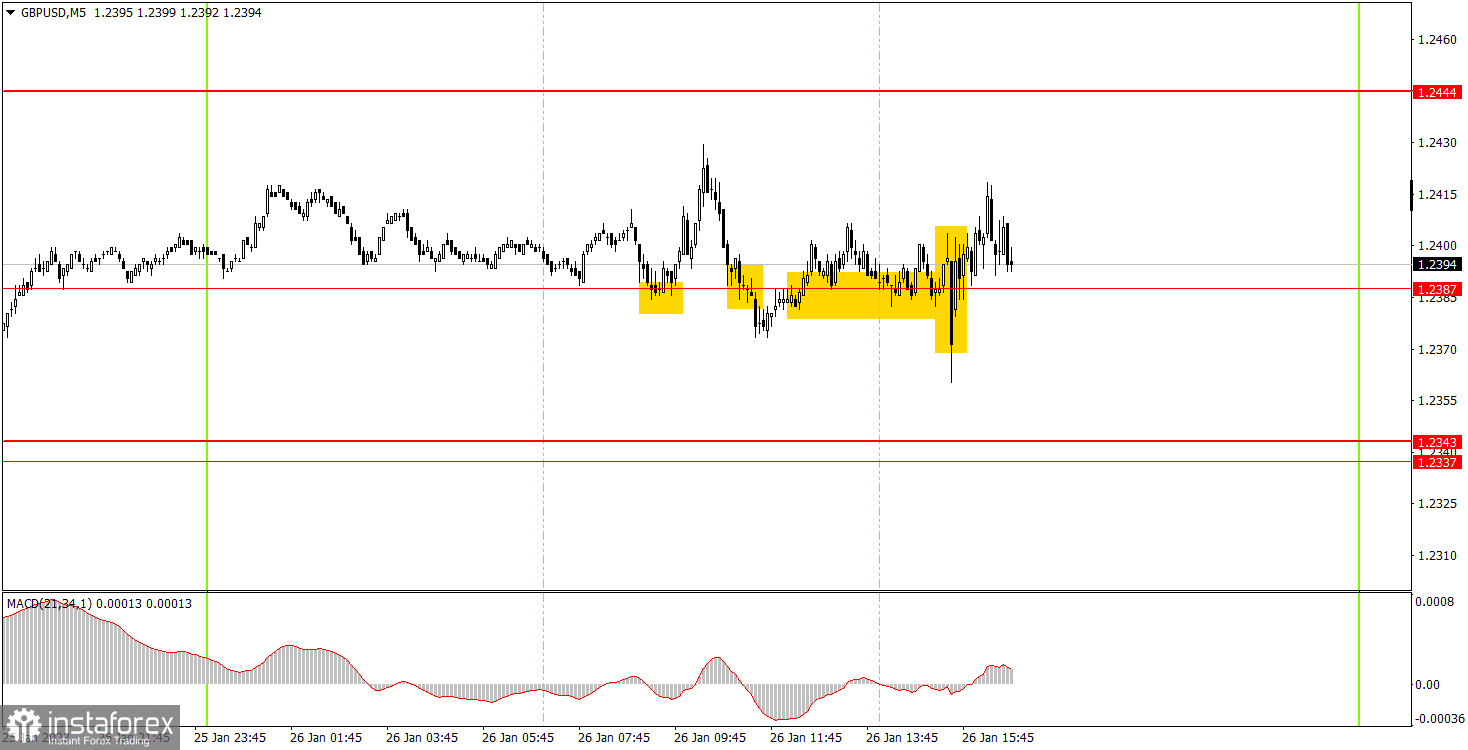
GBP/USD on M5 chart
The nature of the pair's movement on Thursday is clearly seen in the chart above. The pair was moving sideways, along 1.2387, for almost the entire day. Therefore, it is not surprising that all the trading signals were formed near it. And considering the overall volatility, equal to 70 pips, it is not surprising that the pair could not reach the nearest target level to get at least some of the signals correct. As a result, beginners could try to work out only the first two signals. In the first case, a long position had to be closed on Stop Loss at breakeven, as the price had already crept 20 points up that was necessary for this. In the second case, a short position was closed with a small loss since the pair returned above 1.2387 almost immediately.
Trading tips on Friday:
On the 30-minute chart, GBP/USD quickly ended the "outrage" called the "downtrend". Once again, traders did not react to macro data in a logical manner. The pair may stay in flat till the middle of the next week or show completely illogical movements, which are impossible to forecast. On the 5-minute chart, it is recommended to trade at the levels 1.2109, 1.2171-1.2179, 1.2245-1.2260, 1.2337-1.2343, 1.2387, 1.2444-1.2471 and 1.2577-1.2597. As soon as the price passes 20 pips in the right direction, you should set a Stop Loss to breakeven. There are no interesting events scheduled for Friday in the UK, while the US will release reports on personal income and expenditures of the American population, as well as consumer sentiment from the University of Michigan. I don't expect the market to react to this data.
Basic rules of the trading system:
1) The strength of the signal is determined by the time it took the signal to form (a rebound or a breakout of the level). The quicker it is formed, the stronger the signal is.
2) If two or more positions were opened near a certain level based on a false signal (which did not trigger a Take Profit or test the nearest target level), then all subsequent signals at this level should be ignored.
3) When trading flat, a pair can form multiple false signals or not form them at all. In any case, it is better to stop trading at the first sign of a flat movement.
4) Trades should be opened in the period between the start of the European session and the middle of the US trading hours when all positions must be closed manually.
5) You can trade using signals from the MACD indicator on the 30-minute time frame only amid strong volatility and a clear trend that should be confirmed by a trendline or a trend channel.
6) If two levels are located too close to each other (from 5 to 15 pips), they should be considered support and resistance levels.
On the chart:
Support and Resistance levels are the levels that serve as targets when buying or selling the pair. You can place Take Profit near these levels.
Red lines are channels or trend lines that display the current trend and show in which direction it is better to trade now.
The MACD indicator (14, 22, and 3) consists of a histogram and a signal line. When they cross, this is a signal to enter the market. It is recommended to use this indicator in combination with trend patterns (channels and trendlines).
Important announcements and economic reports that can be found on the economic calendar can seriously influence the trajectory of a currency pair. Therefore, at the time of their release, we recommend trading as carefully as possible or exiting the market in order to avoid sharp price fluctuations.
Beginners on Forex should remember that not every single trade has to be profitable. The development of a clear strategy and money management is the key to success in trading over a long period of time.