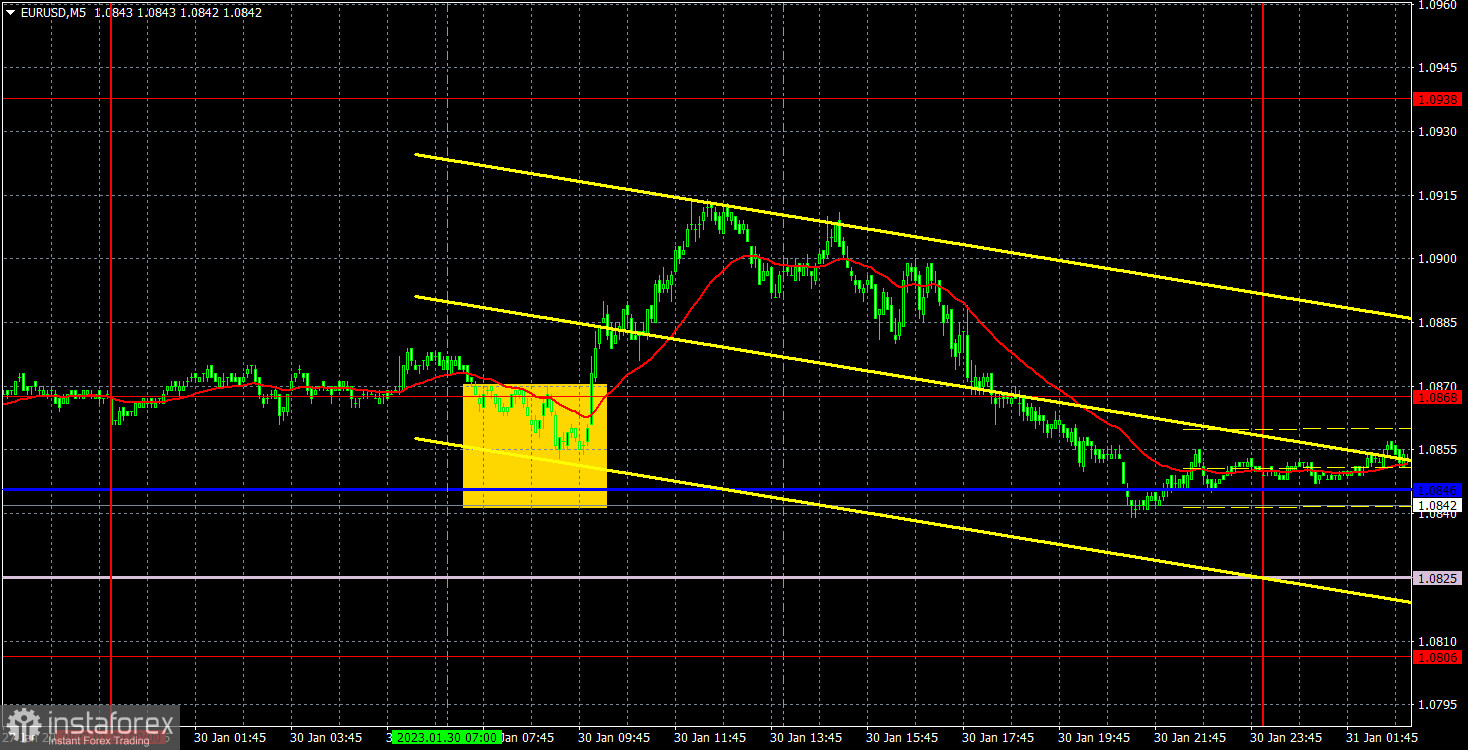
M5 chart of EUR/USD
EUR/USD did not show any interesting movements on Monday. Basically, it's a total flat, and we can only hope that this week's fundamental background is enough for it to end. There was no important data or events in the US or the EU. The only thing we can point out is Spanish inflation, which unexpectedly increased in January and German GDP which dropped much more than expected. However, such data did not really move the pair. I mentioned before that the 40-50 pips flat movement does not make any difference. It doesn't even matter if it was triggered by some event or not. The technical picture did not change and if traders are waiting for the European Central Bank and Federal Reserve meetings, then that means that today's outlook will not change either.
There is nothing much to say about Monday. In the European session, there was one buy signal at 1.0846-1.0868, and the pair moved around 35 pips in the right direction. However, the price failed to reach the nearest target level (which by the way was rather close), therefore the deal was closed with the Stop Loss at breakeven, when the price returned to the area of the signal formation.
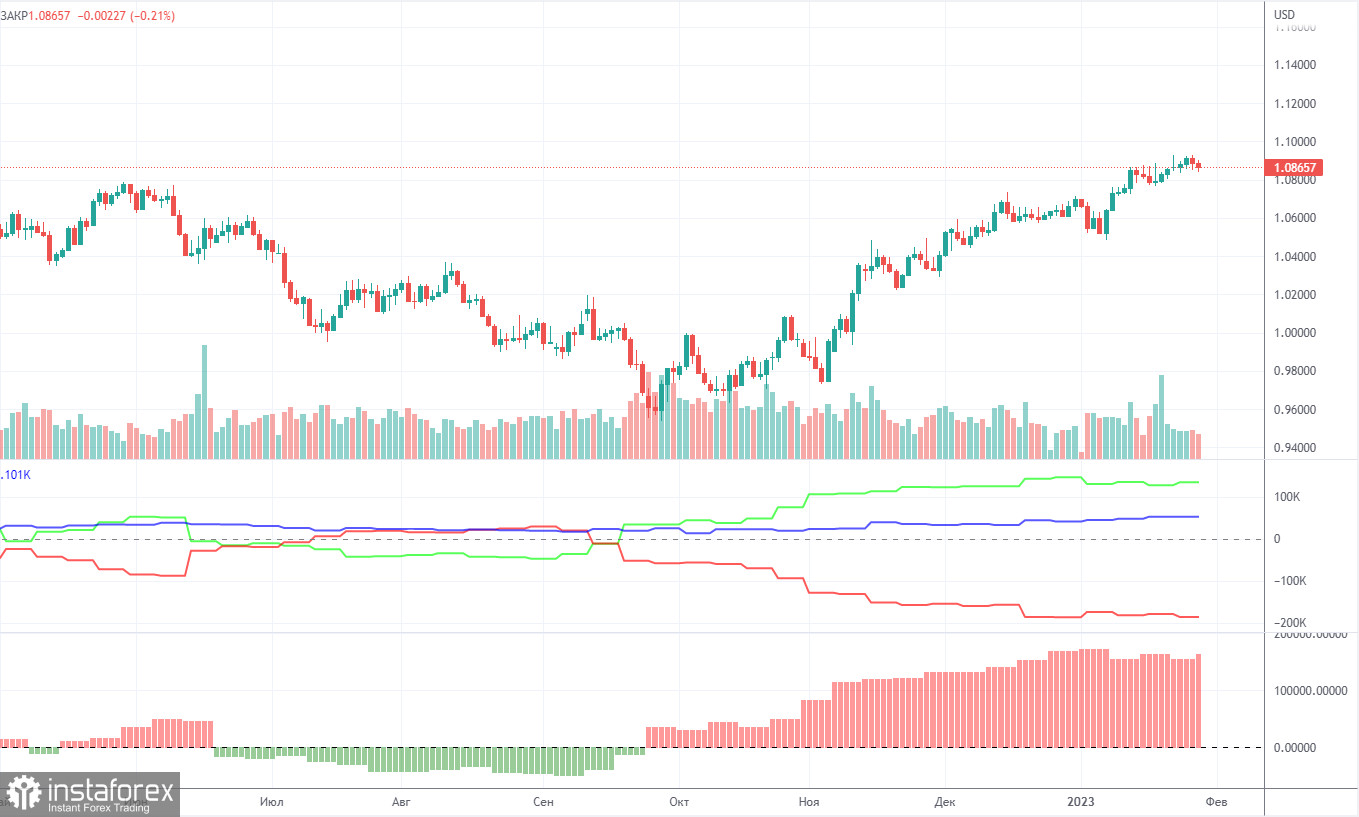
COT report
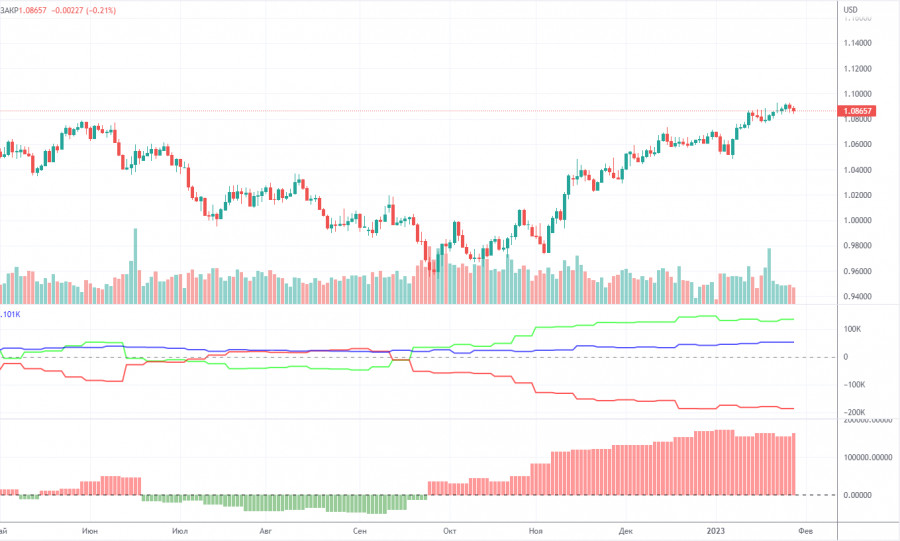
The COT reports for the euro in the last few months have been fully consistent with what is happening in the market. You can clearly see on the chart that the net position of big players (the second indicator) has been growing since early September. Around the same time, the euro started to grow. At this time, the net position of the non-commercial traders has been bullish and strengthens almost every week, but it is a rather high value that allows us to assume that the uptrend will end soon. Notably, the green and red lines of the first indicator have moved far apart from each other, which often precedes the end of the trend. During the given period, the number of long positions held by non-commercial traders decreased by 9,500, whereas the number of short positions fell by 2,000. Thus, the net positions decreased by 7,500. Now the number of long positions is higher than the number of short positions opened by non-commercial traders by 134,000. So now the question is: how long will the big players increase their longs? From a technical perspective, a bearish correction should have started a long time ago. In my opinion, this process can not continue for another 2 or 3 months. Even the net position indicator shows that we need to "unload" a bit, that is, to correct. The overall number of short orders exceeds the number of long orders by 52,000 (732,000 vs. 680,000).
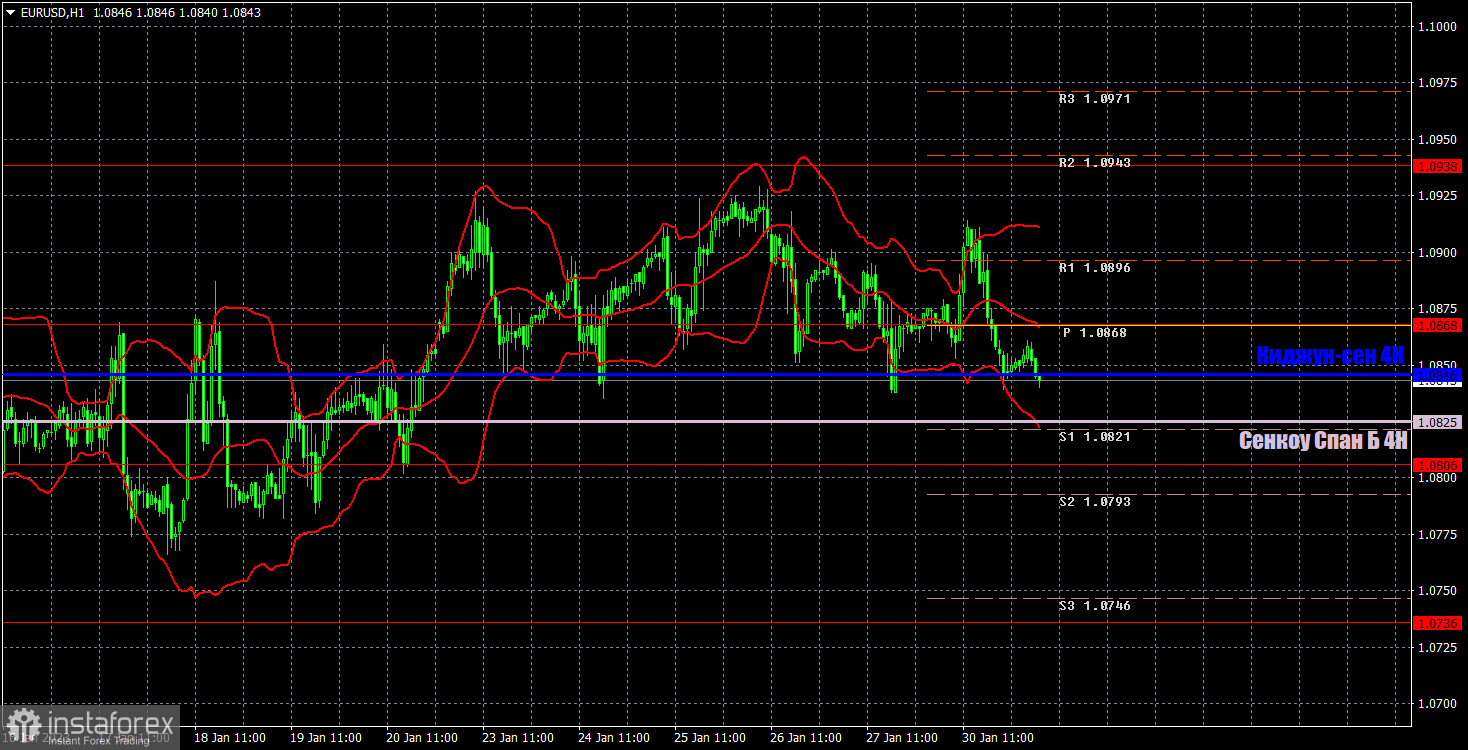
H1 chart of EUR/USD
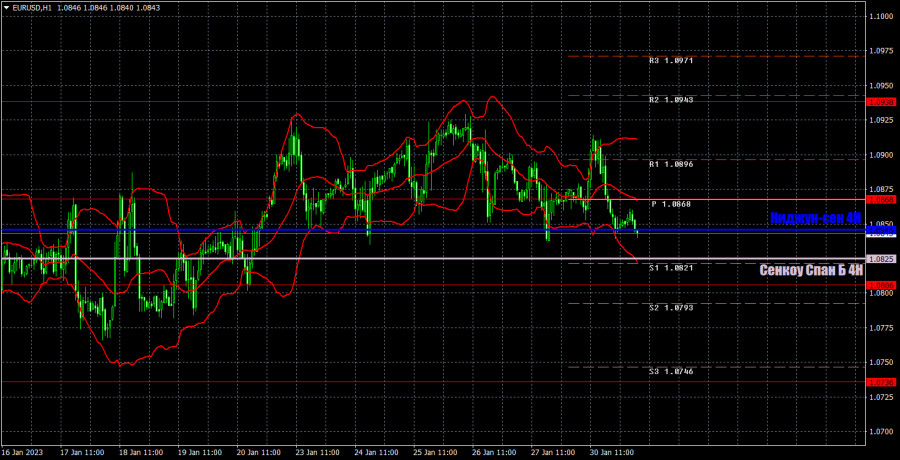
The technical picture on the one-hour chart remains unchanged. We can see that the pair maintains the bullish sentiment, and is located above the lines of the Ichimoku indicator. We have fixed the location of the Kijun-Sen and Senkou Span B lines, because they tend to converge in a flat, and the price can cross them 10 times a day. However, the flat is present, so the trading process is complicated. On Tuesday, the pair may trade at the following levels: 1.0658-1.0669, 1.0736, 1.0806, 1.0868, 1.0938, 1.1036, 1.1137 and also Senkou Span B lines (1.0825) and Kijun Sen (1.0846). Lines of the Ichimoku indicator may move during the day, which should be taken into account when determining trading signals. There are also support and resistance levels, but signals are not formed near these levels. Bounces and breakouts of the extreme levels and lines could act as signals. Don't forget about stop-loss orders, if the price covers 15 pips in the right direction. This will prevent you from losses in case of a false signal. On January 31, the EU will release its first important report of the week, the fourth quarter GDP report. The GDP is expected to fall to 0 or even negative territory. The euro might edge down today.
What we see on the trading charts:
Price levels of support and resistance are thick red lines, near which the movement may end. They do not provide trading signals.
The Kijun-sen and Senkou Span B lines are the lines of the Ichimoku indicator, moved to the one-hour chart from the 4-hour one. They are strong lines.
Extreme levels are thin red lines from which the price bounced earlier. They provide trading signals.
Yellow lines are trend lines, trend channels, and any other technical patterns.
Indicator 1 on the COT charts reflects the net position size of each category of traders.
Indicator 2 on the COT charts reflects the net position size for the non-commercial group.