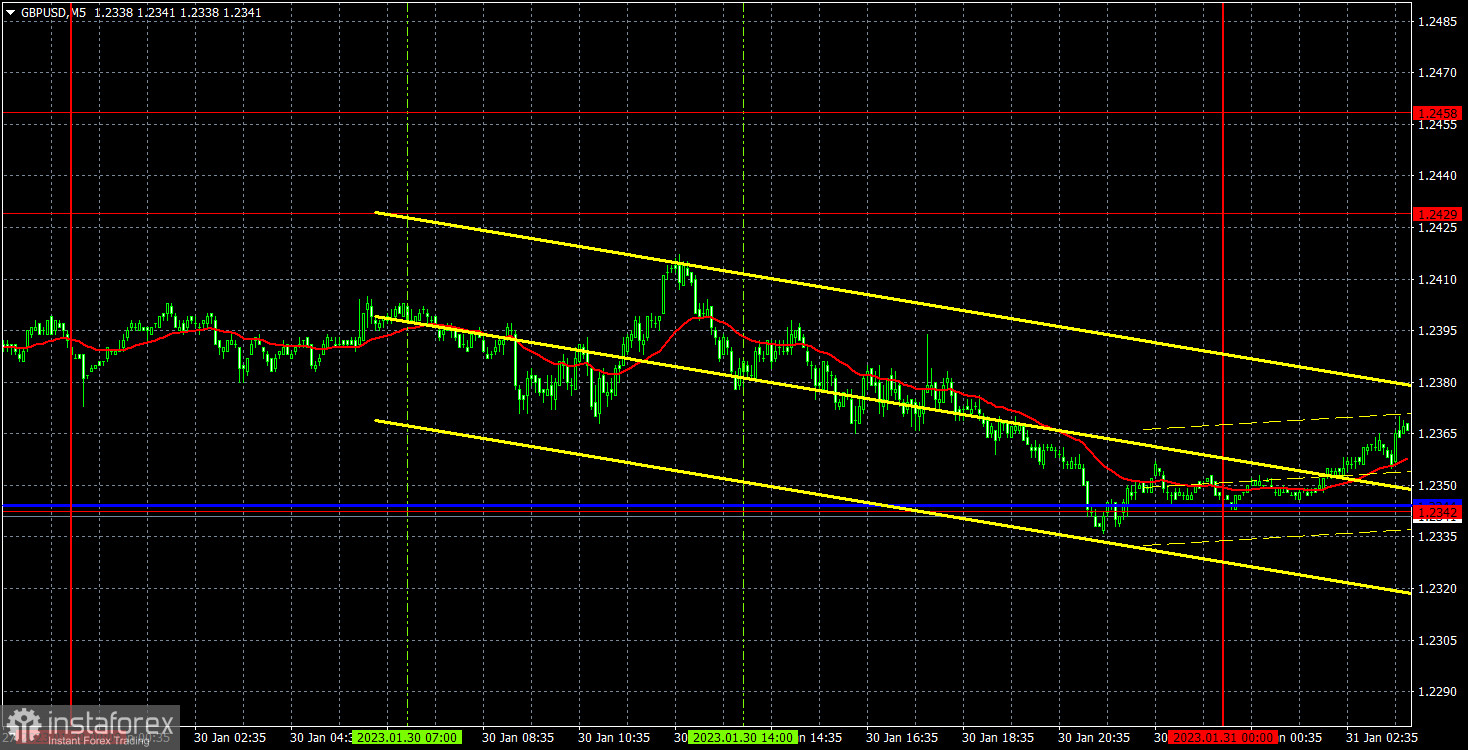
M5 chart of GBP/USD
GBP/USD continues to trade flat between levels 1.2342 and 1.2429. Due to the lack of macro releases during the day, it was not surprising that we did not see any trend and volatile movements. It often happens. The market starts to actively work out the central bank meetings a few days before the results are announced. However, the euro and the pound rose during the last weeks for no reason, that's why I think that the market has already worked out the rate hikes. I still expect both currencies to fall. In the meantime, all we have to do is wait. Traders should decide whether to trade now since there's a high probability of false signals appearing during a flat.
There were no signals on Monday. The pair reached a critical line late in the evening, but due to obvious reasons it wouldn't work out. To some extent, this is actually a good thing, because the signals could turn out to be false. It is better to wait until the flat ends.
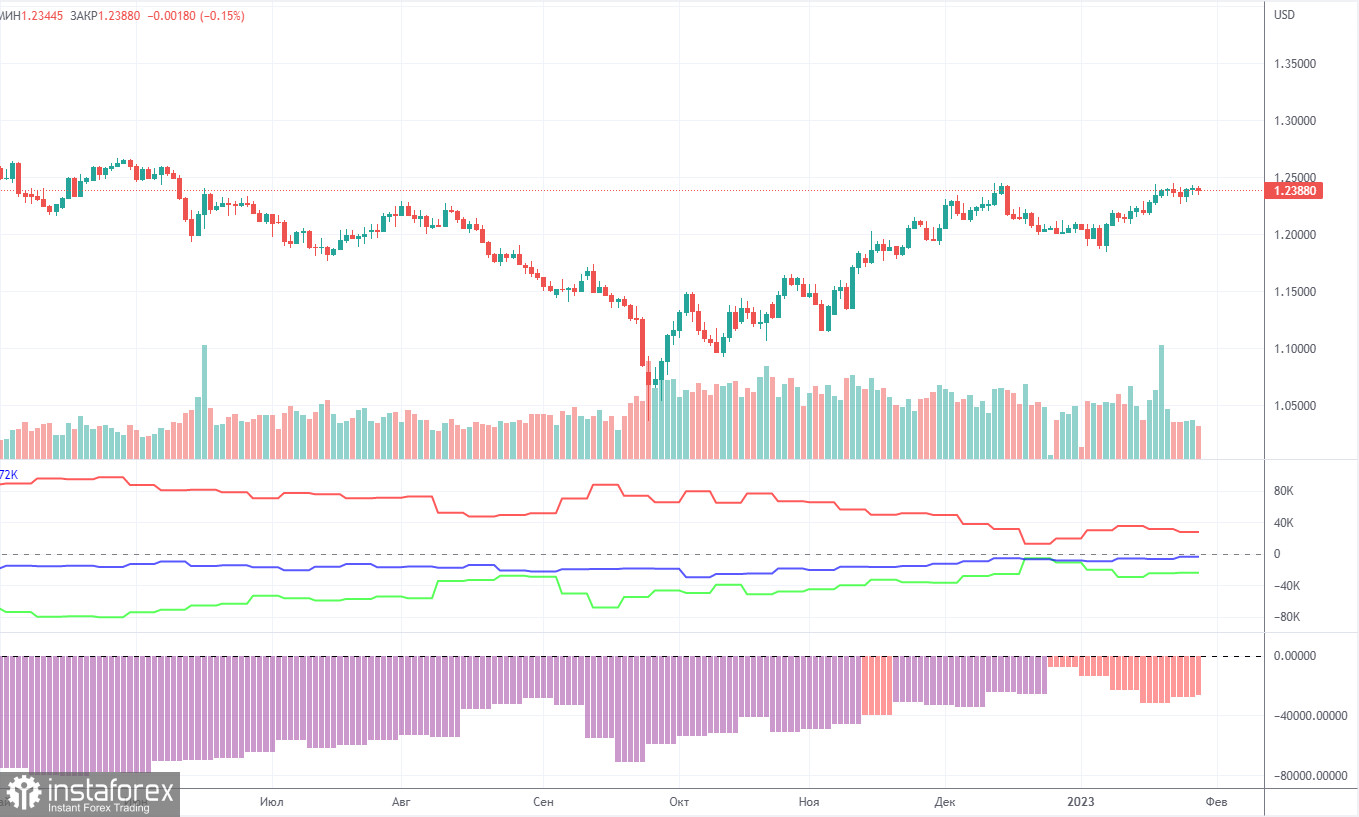
COT report
The latest COT report showed a decrease in bearish sentiment. In a week, non-commercial traders closed 6,700 long positions and 7,500 short positions. The net non-commercial position grew by 800. The net non-commercial position has been on the rise in recent months. The sentiment of large traders may soon turn bullish. Although the pound sterling has been bullish against the greenback in recent months, its growth can hardly be explained with the help of fundamental analysis. We should not rule out the possibility that the pound may fall against the dollar in the medium term as a correction is needed. Overall, the latest COT reports have been in line with the pair's movement. Since the net position is not bullish yet, the buying spree may go on for several months more. Non-commercial traders now hold 35,000 long positions and 59,000 short ones. We are still skeptical about the pair being bullish in the long term although there are technical reasons for that. However, in terms of fundamentals and geopolitics, this will unlikely be a strong and fast uptrend.
H1 chart of GBP/USD
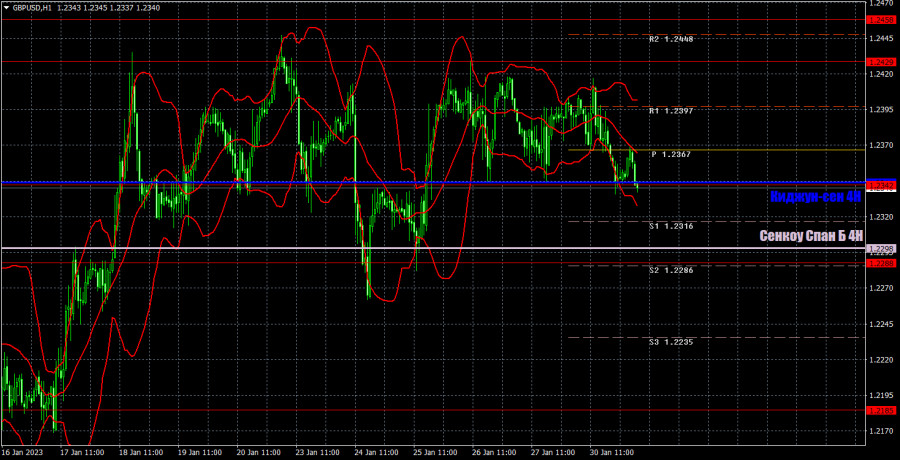
On the one-hour chart, GBP/USD is still moving in the sideways channel. You can clearly see this on the charts. Lines of the indicator Ichimoku are not strong now, but we still fixed their last position in order not to form a ton of false signals near them. Now we will wait for the pair to cross both the Ichimoku indicator lines, since I expect the British currency to fall. However, in this case, US macro data should come upbeat and the Bank of England's decision should be as dovish as possible. On January 31, the pair may trade at the following levels: 1.2106, 1.2185, 1.2288, 1.2342, 1.2429-1.2458, 1.2589, 1.2659. Senkou Span B (1.2298) and Kijun-sen (1.2344) lines may also generate signals. Pullbacks and breakouts through these lines may produce signals as well. A Stop Loss order should be set at the breakeven point after the price passes 20 pips in the right direction. Ichimoku indicator lines may move during the day, which should be taken into account when determining trading signals. In addition, the chart does illustrate support and resistance levels, which could be used to lock in profits. On Tuesday, there are no important events and reports in the UK and US, so traders will have nothing to react to during the day. The flat market is likely to go on. The only thing left is to wait for the central banks' meetings and macroeconomic data, which will start on Wednesday.
What we see on the trading charts:
Price levels of support and resistance are thick red lines, near which the movement may end. They do not provide trading signals.
The Kijun-sen and Senkou Span B lines are the lines of the Ichimoku indicator, moved to the one-hour chart from the 4-hour one. They are strong lines.
Extreme levels are thin red lines from which the price bounced earlier. They provide trading signals.
Yellow lines are trend lines, trend channels, and any other technical patterns.
Indicator 1 on the COT charts reflects the net position size of each category of traders.
Indicator 2 on the COT charts reflects the net position size for the non-commercial group.