When to open long positions on EUR/USD:
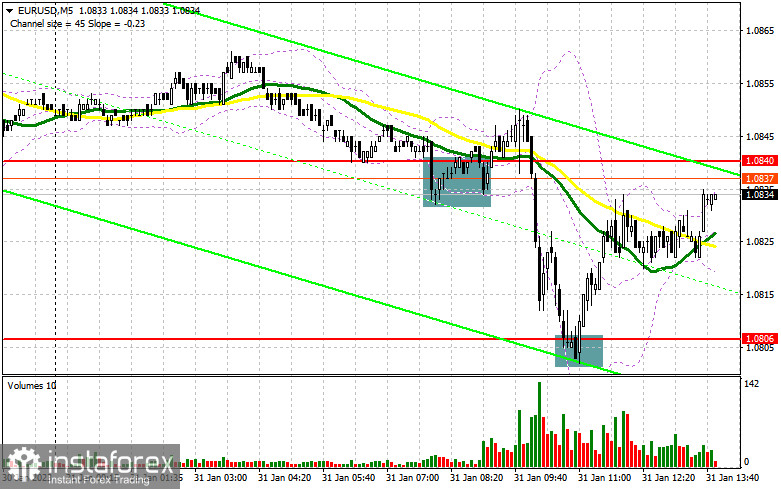
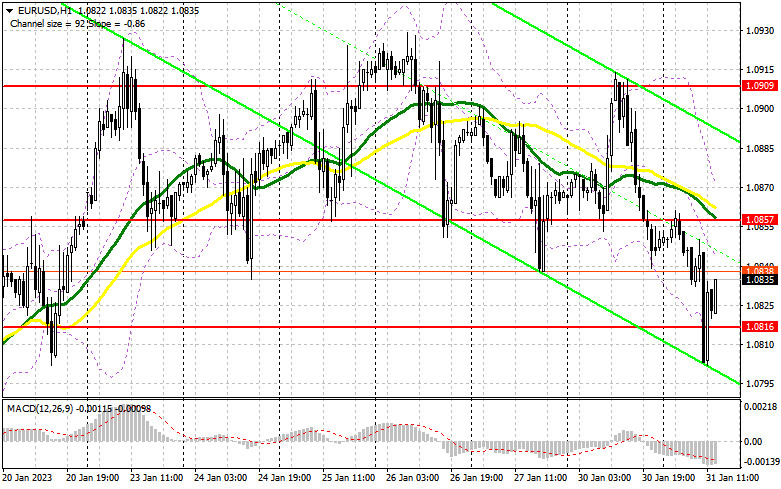
In my morning forecast I pointed out the level of 1.0840 and recommended making market entry decisions with this level in mind. Let us have a look at the 5-minute chart and see what happened. EUR/USD declined into the 1.0840 area before the release of the eurozone GDP and performed a false breakout of that level, which created a buy signal. However, bears pushed the pair below tis level despite GDP data for Q4 2023 being positive. Then, EUR/USD fell to the next support level near 1.0806 and formed another buy signal, which remains relevant as of the moment of writing. The pair moved up by about 30 pips. The technical situation has changed in the second half of the day.
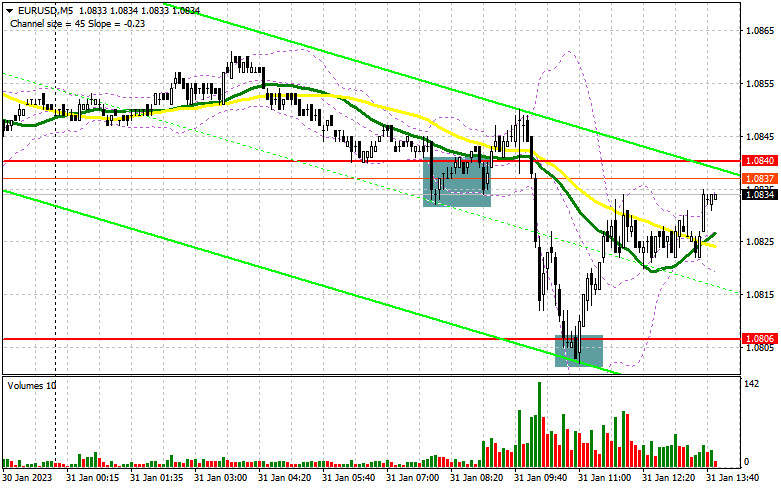
Key data releases during the American session are the CCI index and the PMI data by the University of Chicago. If these data turn out to be strong, the euro may slump in the direction of the new support level of 1.0816, which formed in the first half of the day. A false breakout of that area will create a buy signal and push the pair upward towards the resistance at 1.0857. The moving averages in this area limit the pair's upside potential. However, since market participants are somewhat nervous at this point, a breakout above this level cannot be ruled out. It would create an additional buy signal and send the pair towards 1.0909. If EUR/USD breaks through this level as well, it will trigger stop-loss orders of bears. From there, it may climb to 1.0956, where I would take profit. If EUR/USD declines and bulls are inactive at 1.0816, or if it does not rise significantly after a false breakout in this area, the best course of action would be to close long positions. The key level in this situation is 1.0788 - a false breakout of that area would create another buy signal. Long positions can be opened immediately if the pair bounces off the low at 1.0762 or 1.0732, targeting an intraday correction of 30-35 pips.
When to open short positions on EUR/USD:
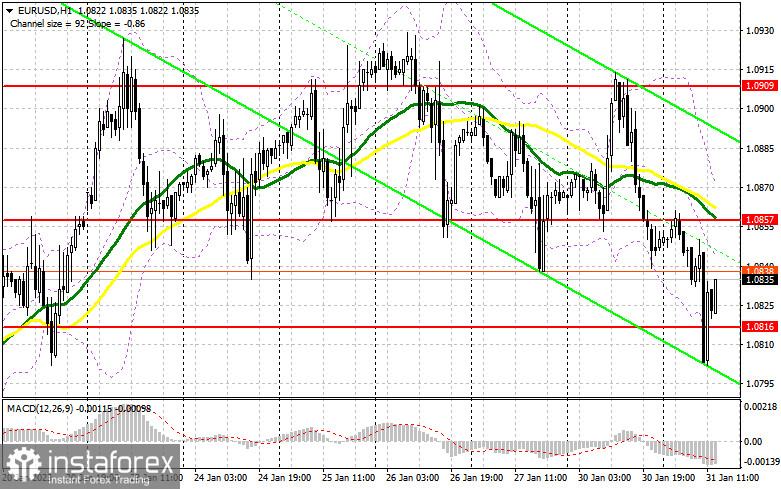
Bears have successfully pushed the euro downwards, threatening the sideways channel the pair had been trading in since January 23. Now bears will need to protect the nearest resistance at 1.0857, which will take a lot of effort. If the consumer confidence data is weak, which is unlikely, only a false breakout of 1.0857 will create a sell signal. The intermediate support at 1.0816 will be the target. A breakout and an upward retest of this level will create a new sell signal, targeting a new weekly low at 1.0788. A consolidation below that range will extend a more significant correction to 1.0762, which will lead to a bear market. I will be taking profits there. If EUR/USD moves up during the American session and bears are idle at 1.0857, the market will be taken over by bullish traders again. In such a case, short positions can be considered near the high at 1.0909. A false breakout of that level will create an excellent entry point. If EUR/USD does not move down strongly from 1.0909, I would rather go short only at the new resistance level of 1.0957, if there is a false breakout of that area. I will sell EUR/USD immediately if it bounces off the high at 1.1003, aiming for a downside correction of 30-35 pips.
Commitment of Traders (COT) report:
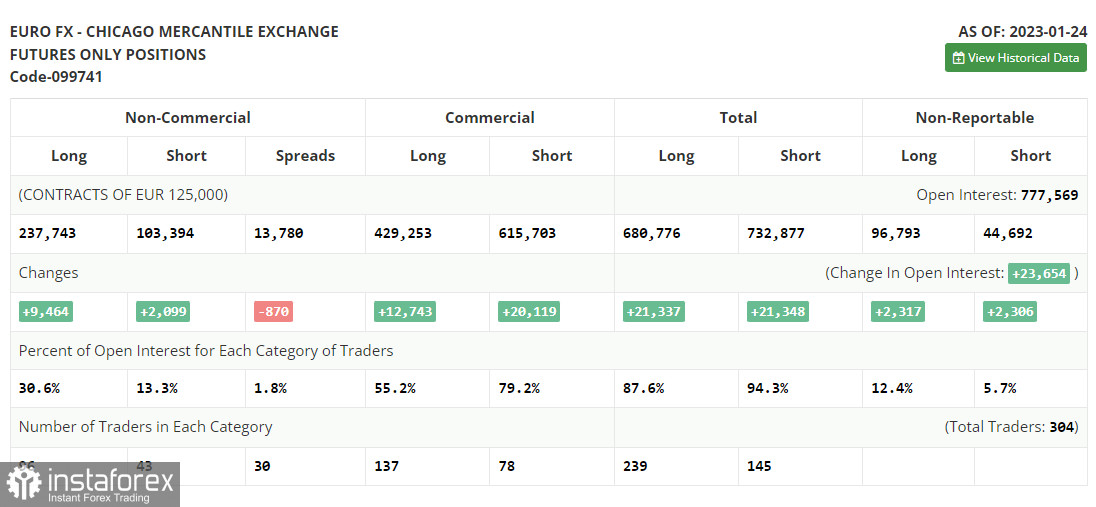
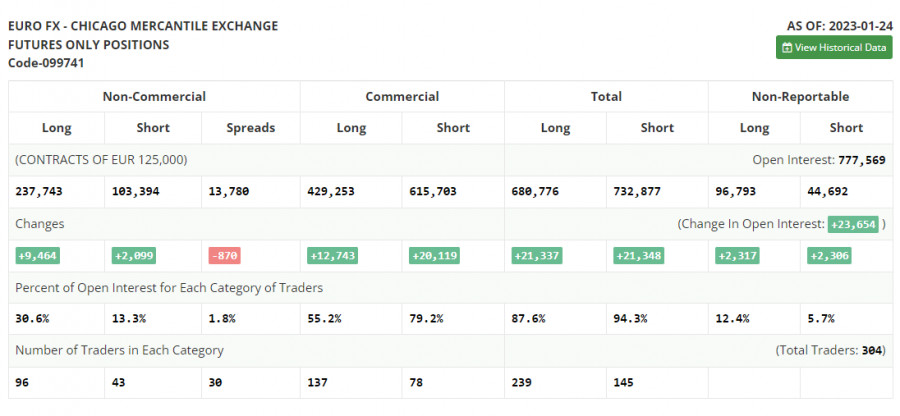
The Commitment of Traders (COT) report for January 24 indicated that both long and short positions increased. It is obvious that traders continued to build up their long positions after speeches of the European Central Bank representatives last week, expecting the European regulator to maintain its aggressive policy. They also bet on a less aggressive Federal Reserve, which may cut the pace of rate hikes for the second time in a row. The recent weak fundamental data on the US economy, particularly falling retail sales and softening inflationary pressures suggest that now is a good time to slow down. Further Fed monetary tightening could hurt the economy even more. Central bank policy meetings will be held this week, which will determine the pair's future trajectory. The COT report showed that long non-commercial positions rose by 9,464 to 237,743, while short non-commercial positions jumped by 2,099 to 103,394. At the end of the week, total non-commercial net positioning was up by 134,349 versus 126,984. All this suggests that investors are confident that the euro will continue to rise, but are waiting for more clarity from central banks on interest rates. The weekly closing price rose to 1.0919 vs. 1.0833.
Indicator signals:
Moving averages:
Trading is carried out below the 30-day and 50-day MA, which indicates that the euro downtrend continues.
Note: The period and prices of moving averages are considered by the author on the H1 (1-hour) chart and differ from the general definition of the classic daily moving averages on the daily D1 chart.
Bollinger Bands
If EUR/USD declines, the lower boundary of the indicator near 1.0816 will provide support.
Description of indicators
- Moving average (moving average, determines the current trend by smoothing out volatility and noise). Period 50. It is marked yellow on the chart.
- Moving average (moving average, determines the current trend by smoothing out volatility and noise). Period 30. It is marked green on the chart.
- MACD indicator (Moving Average Convergence/Divergence - convergence/divergence of moving averages) Quick EMA period 12. Slow EMA period to 26. SMA period 9
- Bollinger Bands (Bollinger Bands). Period 20
- Non-commercial speculative traders, such as individual traders, hedge funds, and large institutions that use the futures market for speculative purposes and meet certain requirements.
- Long non-commercial positions represent the total long open position of non-commercial traders.
- Short non-commercial positions represent the total short open position of non-commercial traders.
- Total non-commercial net position is the difference between the short and long positions of non-commercial traders.