Analyzing Tuesday's trades:
GBP/USD on 30M chart
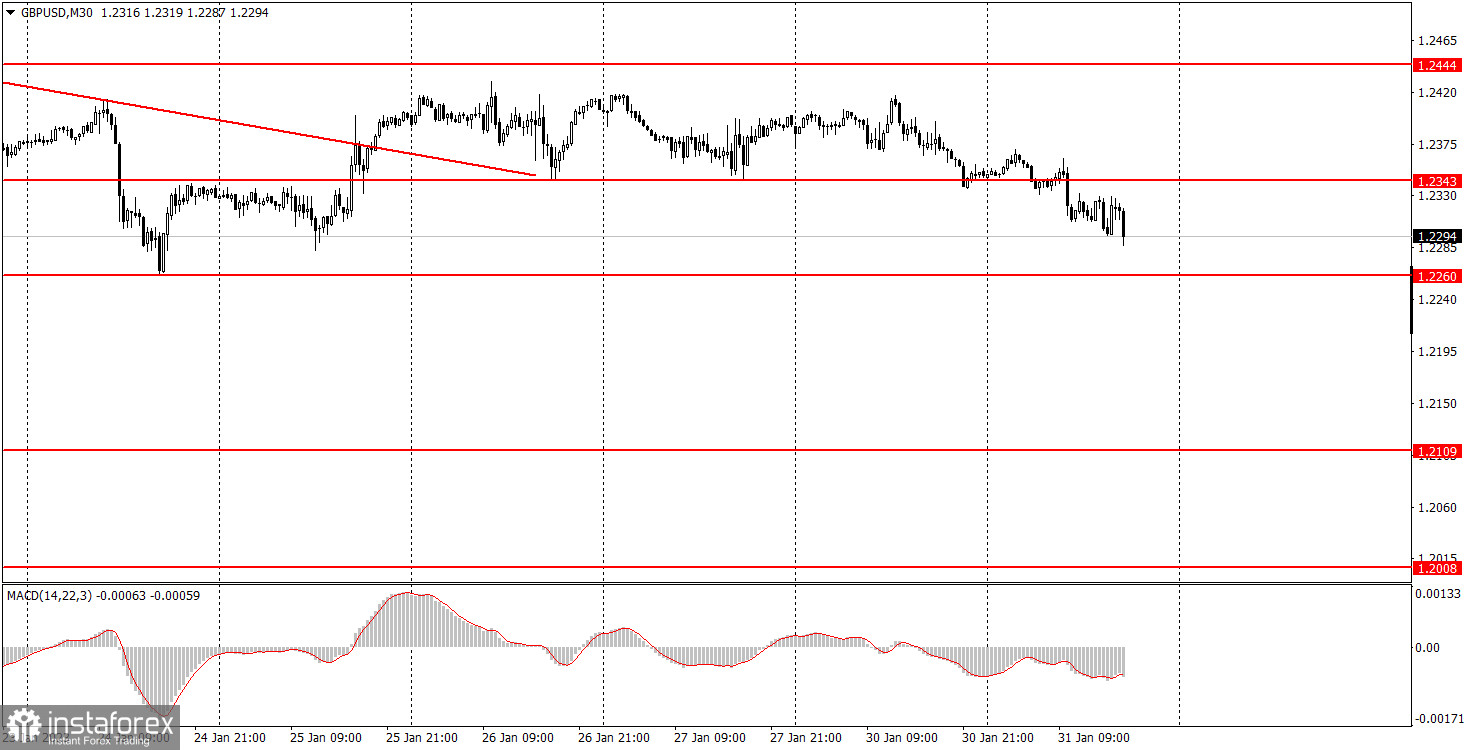
GBP/USD also traded slightly lower on Tuesday. No important reports were released during the day in the UK and the US. On the other hand, the EU released its fourth quarter GDP report, and although it wasn't in line with estimates, it did not provoke a reaction from the market. So traders of the British pound had nothing to react to. But the downward movement and the general volatility of the day were very weak. Market participants are waiting for the meetings of the Federal Reserve and the Bank of England. We could write about it every day because nothing happens at the currency market anyway. The pair is sliding to 1.2260, which is the lower limit of the sideways channel, in which the price has been staying for three weeks. Therefore, for the time being, we are still in a flat. We can only hope that the situation will change on Wednesday, though the outcome of the Fed meeting will be announced late in the evening, so we might see the same low-volatility moves during the day.
GBP/USD on M5 chart
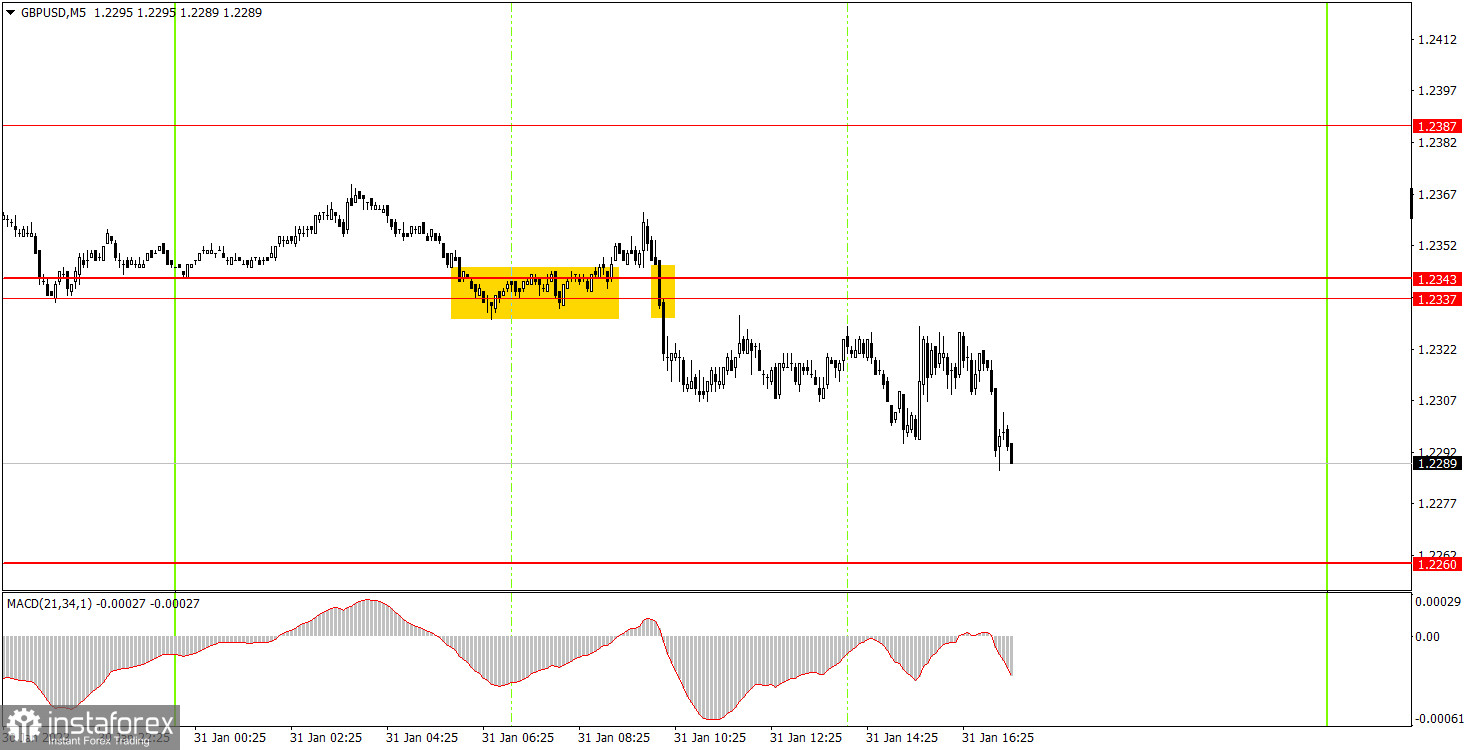
There were two signals on the 5-minute chart. First, the pair rebounded from the 1.2337-1.2343 area and then was able to go up only 10 pips, which was not enough even for the Stop Loss to Breakeven. Then the pair settled below the 1.2337-1.2343 area and managed to fall about 20-25 pips before the evening. Beginners could earn that much on this deal, and at least it completely blocked the loss on the first deal. As a result, the day ended with zero profit, but, taking into account the pair's movement during the last three weeks, such a turn of events is not the worst yet.
Trading tips on Wednesday:
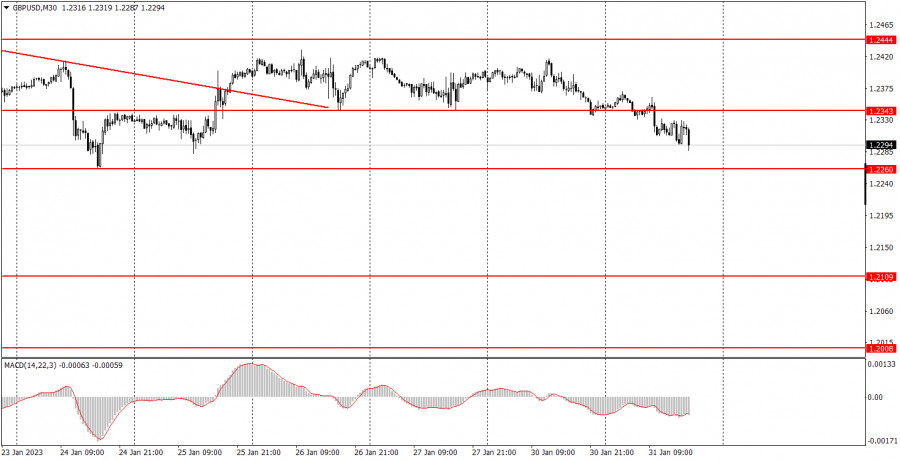
On the 30-minute chart, GBP/USD quickly came out of the downtrend and continues to move inside the 1.2260-1.2444 channel. Important events and messages will start coming in on Wednesday evening, so we can expect one more full day of flat. On the 5-minute chart, it is recommended to trade at the levels 1.2064-1.2079, 1.2109, 1.2171-1.2179, 1.2245-1.2260, 1.2337-1.2343, 1.2387, 1.2444-1.2471, 1.2577-1.2597. As soon as the price passes 20 pips in the right direction, you should set a Stop Loss to breakeven. On Wednesday, the UK is set to release its manufacturing PMI. In the US, we have the ISM manufacturing index for January, and in the evening there's the Fed meeting. Volatility may increase in the afternoon.
Basic rules of the trading system:
1) The strength of the signal is determined by the time it took the signal to form (a rebound or a breakout of the level). The quicker it is formed, the stronger the signal is.
2) If two or more positions were opened near a certain level based on a false signal (which did not trigger a Take Profit or test the nearest target level), then all subsequent signals at this level should be ignored.
3) When trading flat, a pair can form multiple false signals or not form them at all. In any case, it is better to stop trading at the first sign of a flat movement.
4) Trades should be opened in the period between the start of the European session and the middle of the US trading hours when all positions must be closed manually.
5) You can trade using signals from the MACD indicator on the 30-minute time frame only amid strong volatility and a clear trend that should be confirmed by a trendline or a trend channel.
6) If two levels are located too close to each other (from 5 to 15 pips), they should be considered support and resistance levels.
On the chart:
Support and Resistance levels are the levels that serve as targets when buying or selling the pair. You can place Take Profit near these levels.
Red lines are channels or trend lines that display the current trend and show in which direction it is better to trade now.
The MACD indicator (14, 22, and 3) consists of a histogram and a signal line. When they cross, this is a signal to enter the market. It is recommended to use this indicator in combination with trend patterns (channels and trendlines).
Important announcements and economic reports that can be found on the economic calendar can seriously influence the trajectory of a currency pair. Therefore, at the time of their release, we recommend trading as carefully as possible or exiting the market in order to avoid sharp price fluctuations.
Beginners on Forex should remember that not every single trade has to be profitable. The development of a clear strategy and money management is the key to success in trading over a long period of time.