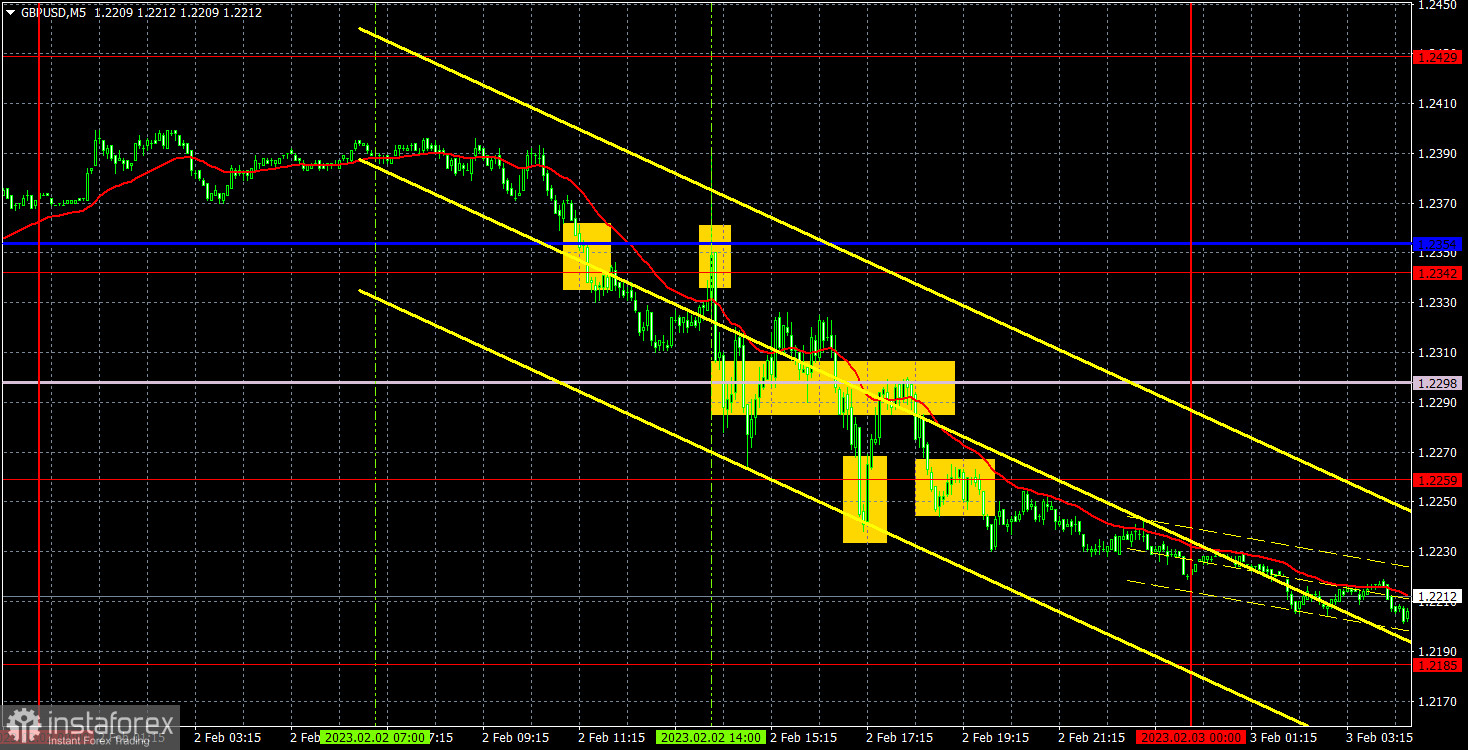
M5 chart of GBP/USD
On Thursday, GBP/USD went down by 180 pips. The market's reaction to the Bank of England's rate decision made no sense at first glance. We have warned that all the hawkish decisions have already been priced. Therefore, the price fell when it should have increased. At the same time, EUR/USD and GBP/USD both traded higher ahead of the meeting and often without reason. That is why their fall after the meeting already made no sense. The Bank of England said nothing about the future of tightening. The ECB made it clear that everything goes as planned and rate hikes may stop in a couple of months. The factor driving the price in recent months no longer has the same influence as it used to. Perhaps the time for a correction has come. The pair settled below the Ichimoku indicator and left the sideways channel it spent three weeks in. Therefore, there is a high likelihood that the quote will go down.
On Thursday, there were many signals generated. The pair was extremely volatile, constantly moving up and down. That is why there was no point in trading in the second half of the day. In the European session, only one sell signal at around 1.2342-1.2354 could have been priced. However, the sell trade should have been closed before the Bank of England's decision announcement.
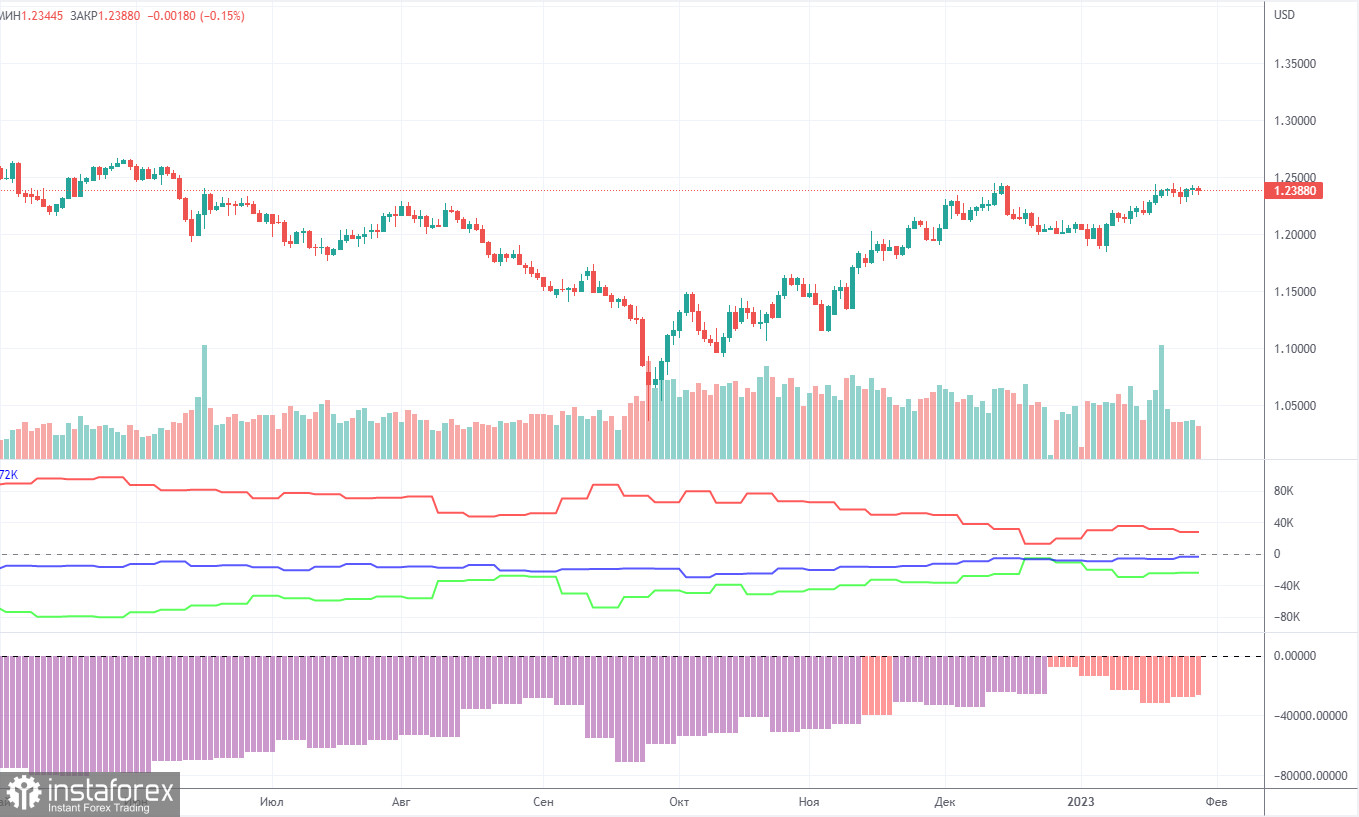
COT report:
The latest COT report showed a decrease in bearish sentiment. In a week, non-commercial traders closed 6,7000 long positions and 7,500 short positions. The net non-commercial position grew by 800. The net non-commercial position has been on the rise in recent months. The sentiment of large traders may soon turn bullish. Although the pound sterling has been bullish against the greenback in recent months, its growth can hardly be explained with the help of fundamental analysis. We should not rule out the possibility that the pound may fall against the dollar in the medium term as a correction is needed. Overall, the latest COT reports have been in line with the pair's movement. Since the net position is not bullish yet, the buying spree may go on for several months more. Non-commercial traders now hold 35,000 long positions and 59,000 short ones. We are still skeptical about the pair being bullish in the long term although there are technical reasons for that. However, in terms of fundamentals and geopolitics, this will unlikely be a strong and fast uptrend.
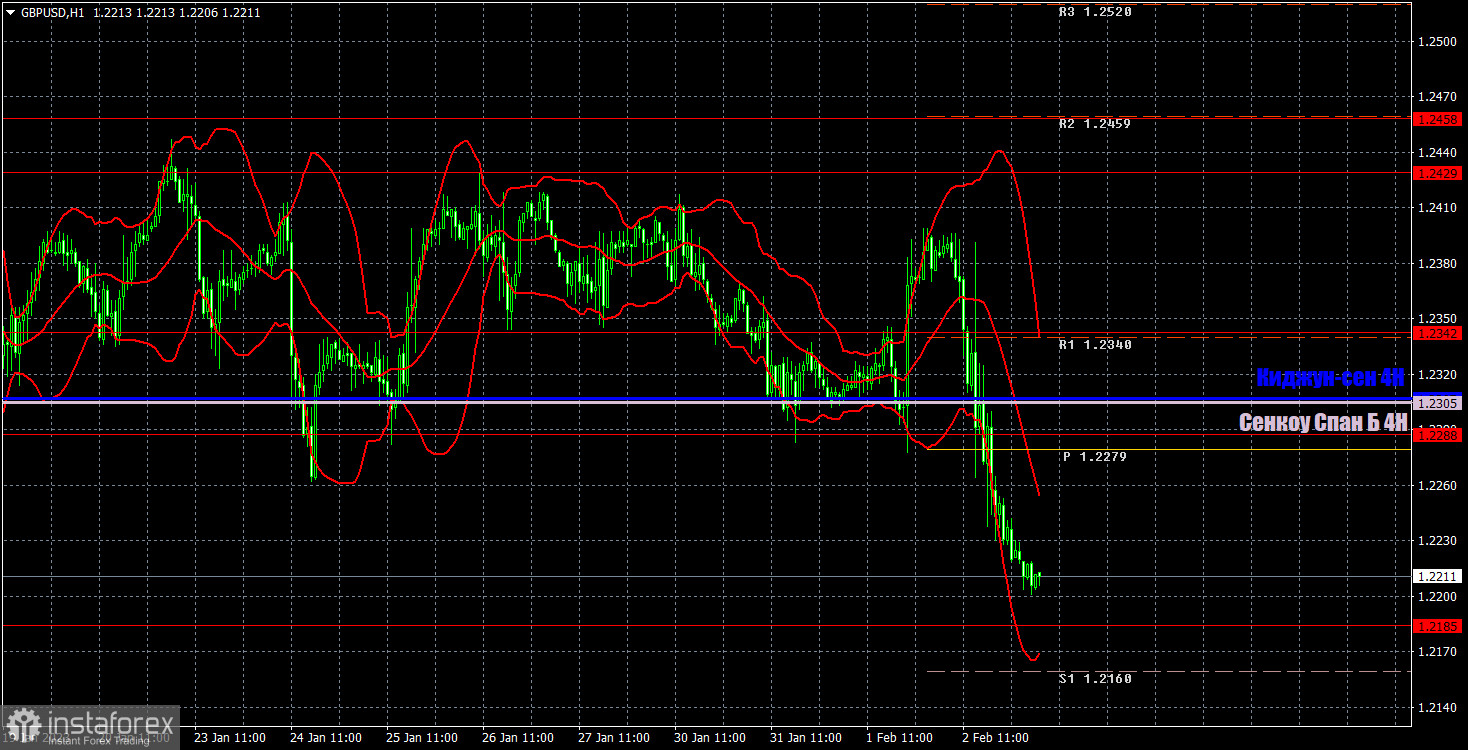
H1 chart of GBP/USD
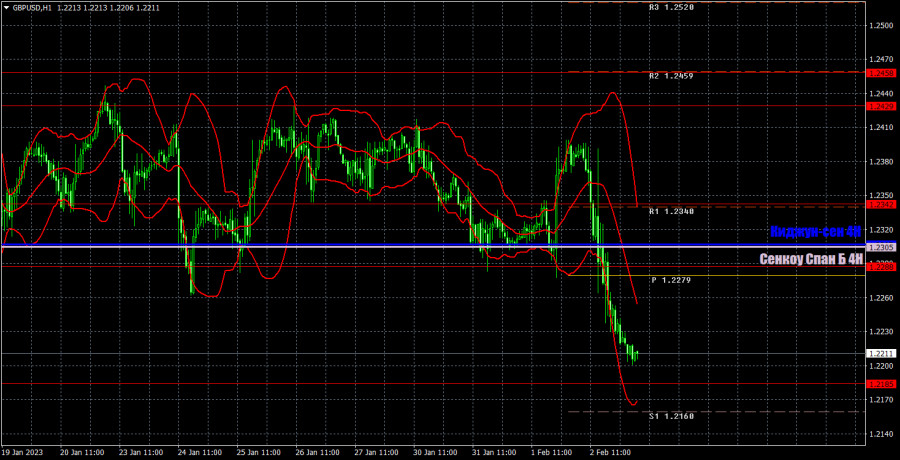
According to the H1 time frame, GBP/USD has finally left the sideways channel and has shown some short-term bearish signs. The quote may tumble by some 500-600 pips if it fails to rise above the Ichimoku indicator shortly. At the same time, fresh data from the US may trigger a fall in the greenback and put an end to the downtrend. Today, important levels are seen at 1.1974-1.2007, 1.2106, 1.2185, 1.2288, 1.2342, and 1.2429-1.2458. Senkou Span B (1.2307) and Kijun-sen (1.2307) may also generate signals when the price either breaks or rebounds from them. Don't forget to place a stop-loss order at the breakeven point when the price passes 20 pips in the right direction. Ichimoku indicator lines can move during the day, which should be taken into account when determining trading signals. There are also support and resistance although no signals are made near these levels, which can be used for locking in profits. On Friday, the UK will see the release of its services PMI. The US will deliver data on unemployment, wages, the jobs market, and the ISM services PMI. The market may show a strong reaction to any of these reports.
Indicators on charts:
Resistance/support - thick red lines, near which the trend may stop. They do not make trading signals.
The Kijun-sen and Senkou Span B lines are the Ichimoku indicator lines moved to the hourly timeframe from the 4-hour timeframe. They are also strong lines.
Extreme levels are thin red lines, from which the price used to bounce earlier. They can produce trading signals.
Yellow lines are trend lines, trend channels, and any other technical patterns.
Indicator 1 on the COT chart is the size of the net position of each trader category.
Indicator 2 on the COT chart is the size of the net position for the Non-commercial group of traders.