Overview of Monday trades:
EUR/USD on 30M chart
EUR/USD continued to decline on Monday but with less volatility. As we have mentioned before, the momentum movement from Friday and Thursday continued through Monday. There was no macroeconomic news that day and even Christine Lagarde's speech later in the evening had no effect on the market. So, the European currency continues to decline following the robust macroeconomic data from the US released last week. It was also affected by the ECB and the Fed's meetings. In theory, the euro/dollar may extend its decline today as well. The thing is, the pair was largely overbought last week and was moving up with no corrections or pullbacks for more than a month. Yet, the fundamental and economic background will be of no help to the euro this week. Despite a deep fall over the past few days, we cannot see any trendline or channel on the chart. However, we clearly have a downtrend here.
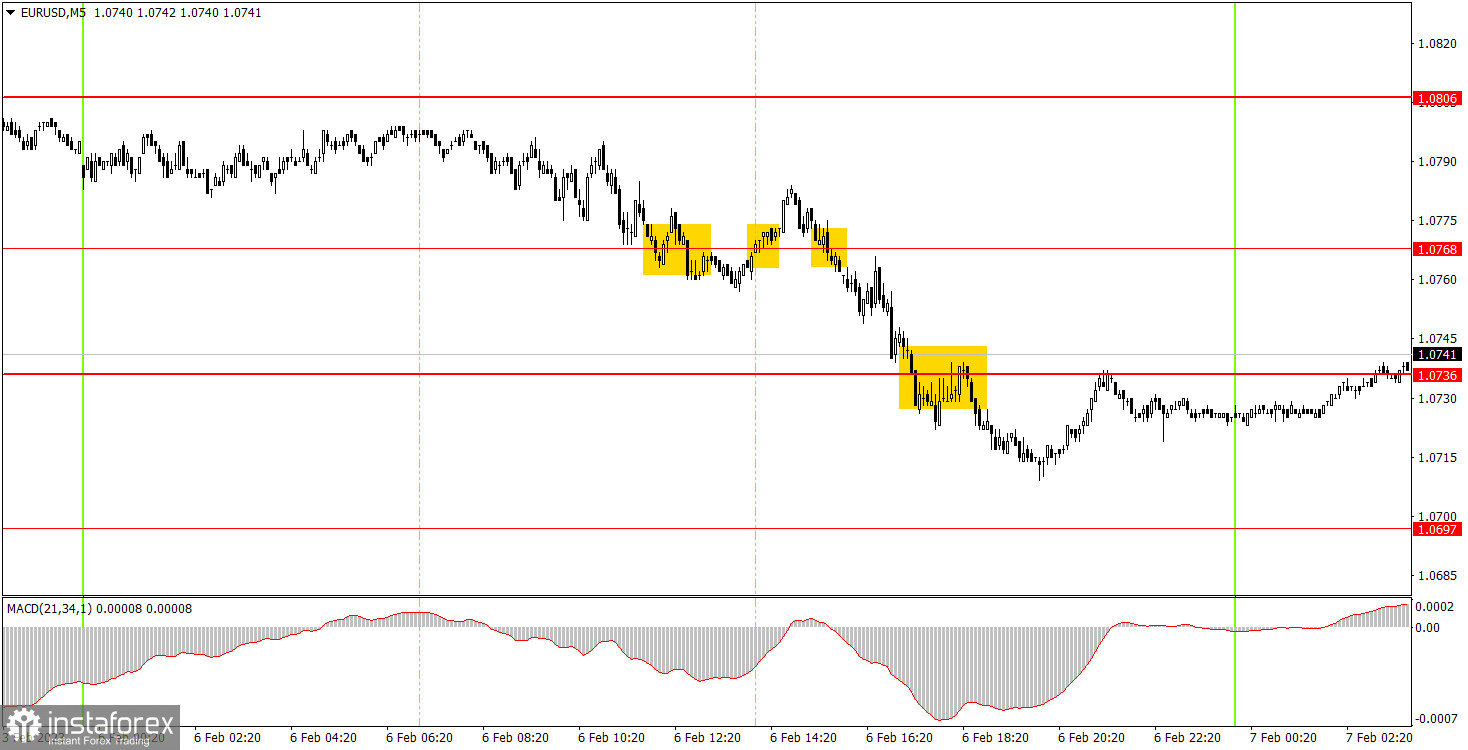
EUR/USD on 5M chart
Although the pair was moving as usual on Monday, the trading signals we got were far from perfect. The first three signals were formed near the level of 1.0768 and two of them were false. The price made an excessive spiral near this level which caused those false signals. It was impossible even to set a Stop Loss to breakeven for both buy and sell trades. The quote failed to pass at least 15 pips in the right direction. Therefore, both trades ended with small losses. The third signal near the level of 1.0768 was an accurate one but still should not have been followed due to the two previous false signals. This was a bad day for trading but not every trade has to be profitable every day. The last signal near 1.0736 ended with a Stop Loss triggered at the breakeven.
Trading tips on Tuesday:
On the 30-minute time frame, the pair continues to move downwards without any signs of a slowdown. We expect to see even a deeper decline in the euro as its recent growth was unjustified. There are currently no trendlines or channels on the chart. The pair needs an upside correction to get the second support. On the 5-minute time frame on Tuesday, it is recommended to trade at the levels of 1.0587-1.0607, 1.0657-1.0668, 1.0697, 1.0736, 1.0768, 1.0806, 1.0857-1.0867, 1.0920-1.0923-1.0933, and 1.0966. As soon as the price moves by 15 pips in the right direction, set a Stop Loss to breakeven. No important events are expected in the EU on Tuesday. In the US, Jerome Powell will make a statement. Although we do not expect to learn anything new from the Fed Chairman, markets can still react to this event.
Basic rules of the trading system
1) The strength of the signal is determined by the time it took the signal to form (a rebound or a breakout of the level). The quicker it is formed, the stronger the signal is.
2) If two or more positions were opened near a certain level based on a false signal (which did not trigger a Take Profit or test the nearest target level), then all subsequent signals at this level should be ignored.
3) When trading flat, a pair can form multiple false signals or not form them at all. In any case, it is better to stop trading at the first sign of a flat movement.
4) Trades should be opened in the period between the start of the European session and the middle of the US trading hours when all positions must be closed manually.
5) You can trade using signals from the MACD indicator on the 30-minute time frame only amid strong volatility and a clear trend that should be confirmed by a trendline or a trend channel.
6) If two levels are located too close to each other (from 5 to 15 pips), they should be considered support and resistance levels.
On the chart
Support and Resistance levels are the levels that serve as targets when buying or selling the pair. You can place Take Profit near these levels.
Red lines are channels or trend lines that display the current trend and show in which direction it is better to trade now.
The MACD indicator (14, 22, and 3) consists of a histogram and a signal line. When they cross, this is a signal to enter the market. It is recommended to use this indicator in combination with trend patterns (channels and trendlines).
Important announcements and economic reports that can be found on the economic calendar can seriously influence the trajectory of a currency pair. Therefore, at the time of their release, we recommend trading as carefully as possible or exiting the market in order to avoid sharp price fluctuations.
Beginners on Forex should remember that not every single trade has to be profitable. The development of a clear strategy and money management is the key to success in trading over a long period of time.