On Thursday, EUR/USD retraced up somewhat. Intraday volatility was moderate as no fundamentals came. The US macro data released yesterday was of secondary importance, the ECB raised interest rates by 0.50% as expected, and Christine Lagarde's speech was uninteresting. All that was reflected in traders' reaction. If the ECB's president had given some useful hints, the reaction would have been stronger. All in all, the situation on the chart did not change much yesterday. The pair is still trading horizontally. This week, market swings have been triggered solely by the news about the collapse of certain banks, with a fall in the greenback followed by a decline in the euro. Today, we may see a surge in price but within a flat trend. There will be practically no macroeconomic or fundamental factors on Friday. The ECB did not give answers to any of the crucial questions.
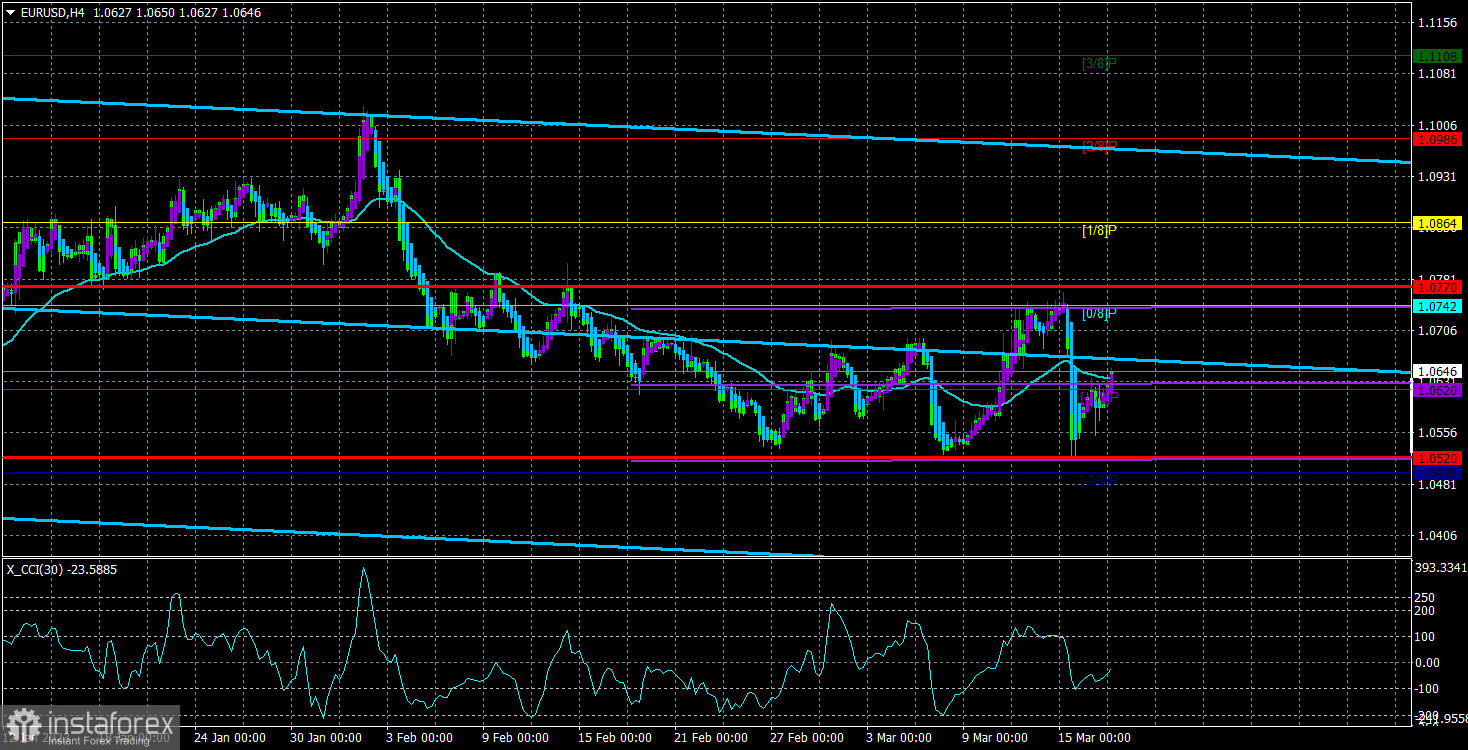
In the 24-hour time frame, the situation has not changed. The pair consolidated below the Senkou Span B and the Kijun-sen the day before yesterday, allowing us to expect a fall in price. Nevertheless, the pair has been in a flat trend. Therefore, the Ichimoku lines carry no weight in the 24-hour time frame. In the 4-hour time frame, the price broke through the moving average. In fact, we have seen many MAs in recent weeks. Consequently, consolidation below the MA means nothing as well. In the medium term, we still expect the price to go down because its correction after the September-February growth was not enough.
The ECB has raised interest rates by 0.50% as expected. In fact, the market has been aware of the decision for a couple of months. So, it had enough time to price the move. That is why no reaction followed after the announcement. Still, there were several crucial remarks the market paid attention to. Christine Lagarde said that the regulator would make decisions on monetary policy with macro data in mind from now on. This means that rate hikes will now depend on the ECB's possibilities, the health of the economy and banking system as well as inflation. In other words, the bank will unlikely lift rates by another 0.50% in May. Clearly, the ECB has fewer possibilities than the US Federal Reserve. The US regulator is free to raise rates as it wants. Meanwhile, the ECB is ruled by the EU government and has to care about all the member states. Significantly higher rates would simply have harmed the weaker EU economies. Therefore, the ECB's rates will unlikely be lifted as high as the Federal Reserve's. Moreover, inflation will not slow down to 2% in a blink of an eye. Even the US understands that it will not go down to the target level in 2023-2024.
By the way, the ECB has revised its inflation outlook for the coming years. It now expects inflation at 5.3% in 2023, 2.9% in 2024, and 2.1% in 2025. Inflation is likely to remain too high for too long, the regulator said. Some analysts say that this outlook is too optimistic, and the reality could be much worse.
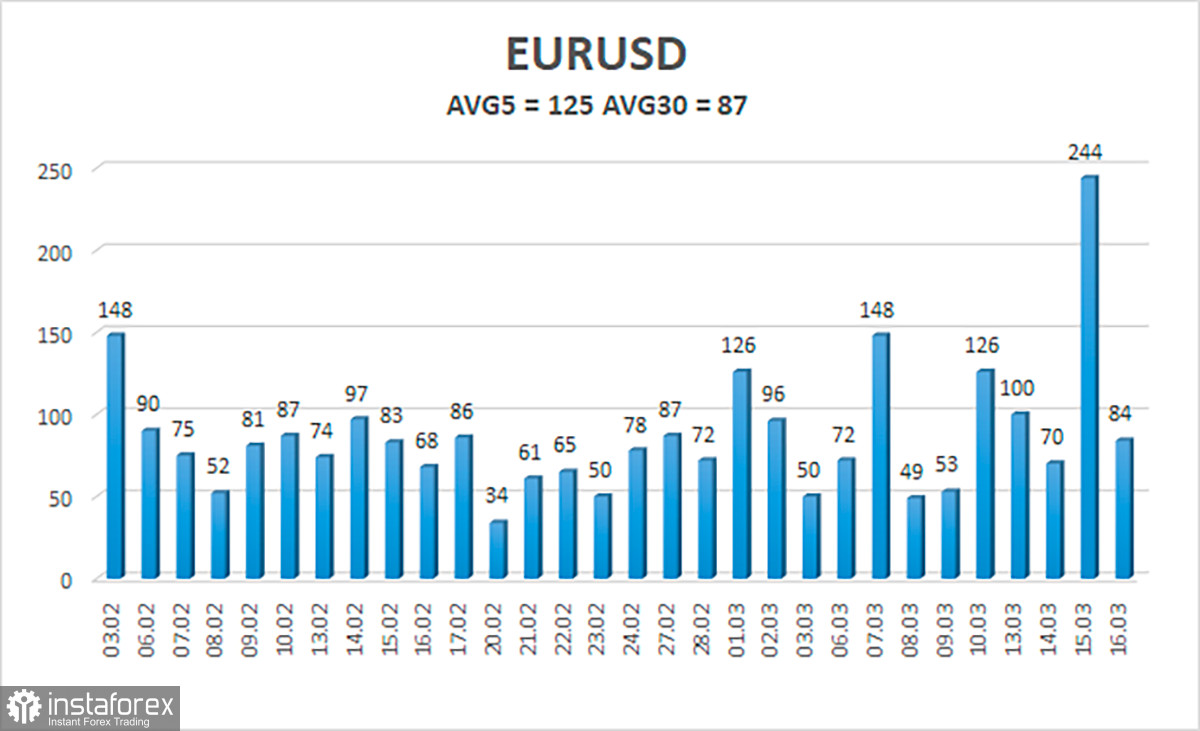
The 5-day average volatility of EUR/USD totals 125 pips on March 17 and is considered high. We anticipate the price to be in the range between 1.0520 and 1.0770 on Friday. The Heiken Ashi's reversal to the downside will illustrate a fall within the flat trend.
Support:
S1 – 1.0498
Resistance:
R1 – 1.0620
R2 – 1.0742
R3 – 1.0864
Outlook:
EUR/USD keeps trading below the moving average. The trading plan will be to sell with targets at 1.0520 and 1.0498 if the Heiken Ashi reverses to the downside or bounces off the moving average. It will become possible to buy after consolidation above the moving average, targeting 1.0742 and 1.0770.
Indicators on charts:
Linear Regression Channels help identify the current trend. If both channels move in the same direction, a trend is strong.
Moving Average (20-day, smoothed) defines the short-term and current trends.
Murray levels are target levels for trends and corrections.
Volatility levels (red lines) reflect a possible price channel the pair is likely to trade in within the day based on the current volatility indicators.
CCI indicator. When the indicator is in the oversold zone (below 250) or in the overbought area (above 250), it means that a trend reversal is likely to occur soon.