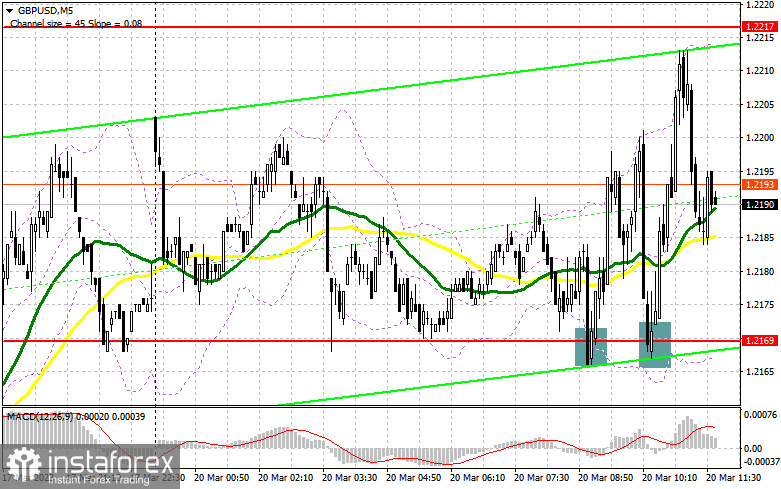
In my morning review, I mentioned the level of 1.2169 as a possible entry point. Let's discuss what happened on the 5-minute chart. A decline to this level and its false breakout generated a buy signal. As a result, the pair went up by more than 40 pips. The technical setup remained the same for the second half of the day.
For long positions on GBP/USD:
Apparently, the lack of any fundamental statistics in the US will favor the British pound. Yet, bulls still need to make an effort to reach new monthly highs if they intend to continue the uptrend. If the pair comes under pressure in the course of the New York session, the best moment to go long will be a false breakout at the support level of 1.2169 similar to the one I discussed earlier. Below this level, we can see the moving averages playing on the side of the bulls. In this scenario, the pound may surge to the resistance at 1.2217. After settling there and testing this range from top to bottom, the stop-loss orders set by the bears will be triggered. If so, GBP/USD is set to rise to a new monthly high of 1.2265 where bulls will face serious obstacles. It is advisable to buy at this point only after a breakout and a rise toward 1.2321, where I will be taking profit. The bulls are likely to fail to open new positions at 1.2169 in the second half of the day since the price has already tested this range four times during the day. Therefore, the pressure on the pound may resume. If this is the case, then I would recommend going long only at the next support level of 1.2124 and only on a false breakout. I will buy GBP/USD right after a rebound from the low of 1.2079, bearing in mind an intraday correction of 30-35 pips.
For short positions on GBP/USD:
All attempts made by the sellers have failed. As long as the pair is trading below 1.2217, bears still have a chance to develop a correction. The best moment to sell the pair in the North American session will be a false breakout at this range which will be a great signal to open short positions. If so, GBP/USD may decline to the support of 1.2169 that has been tested in the European trade. This will trap the pair in the sideways channel at the start of the week. Only a breakout of 1.2169 and its downward retest will exert more pressure on the pound and generate a sell signal with a downward target at 1.2124. The low of 1.2079 is the lowest target where I will be taking profit. If GBP/USD rises, and bears are idle at 1.2217, bears will continue to leave the market. In this case, only a false breakout at the resistance at 1.2265 will give us a good entry point into short positions. If the pair won't drop from this level, I will sell it right after a rebound from the high of 1.2321, considering a downside correction of 30-35 pips within the day.
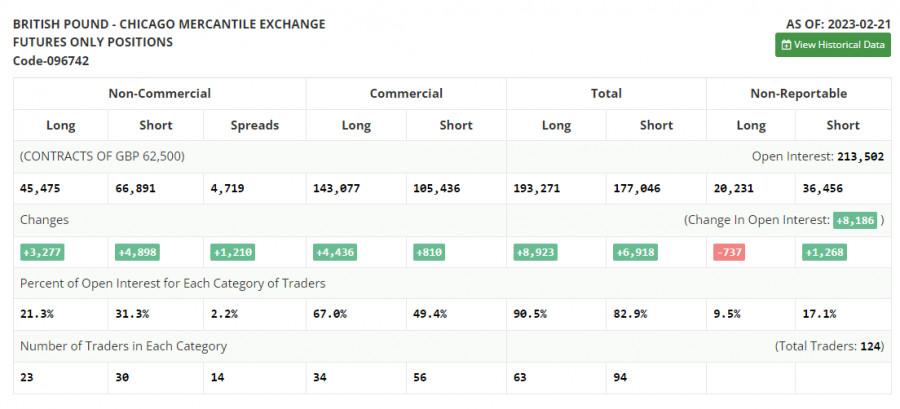
COT report
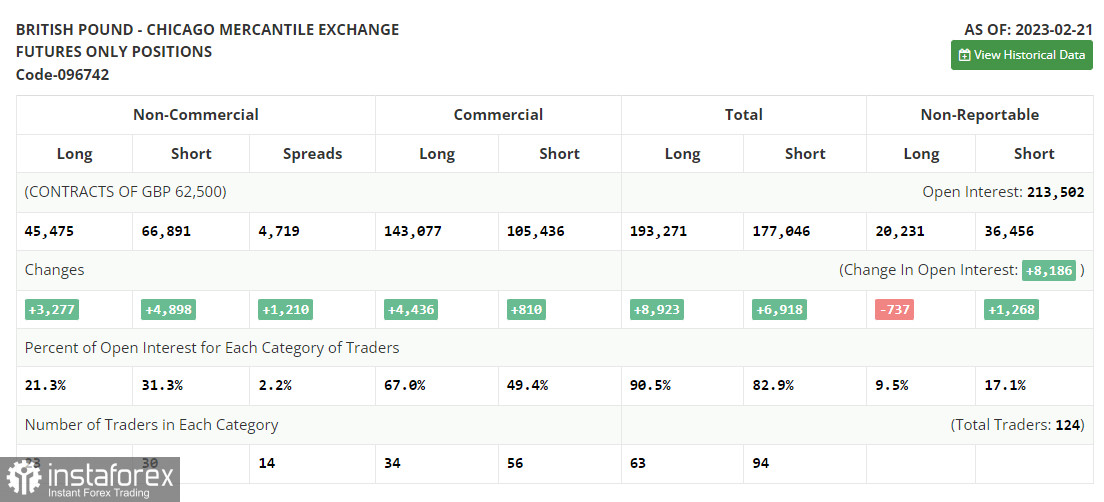
The Commitments of Traders report for February 21 recorded a rise in both long and short positions. However, this data is not of big importance right now. After a cyber attack on the CFTC, fresh figures are not out yet so the data from a month ago is actually not that relevant. Let's wait for new COT reports to get a better understanding of the market. This week, traders will take notice of the UK labor data and average earnings. Based on this, the Bank of England will decide on future interest rates, considering persistently high inflation. Increased household earnings may keep the inflation rate at the current peak levels. The CPI data in the US may serve as a confirmation that the Fed and its Chair Jerome Powell will not tighten monetary policy any further. The risk of a collapsing banking sector in the US that was triggered by the bankruptcy of the SVB has certainly changed the stance of the regulator. The Fed may want to ease the tightening to avoid more harm to the economy. According to the latest COT report, short positions of the non-commercial group of traders went up by 277 to 45,475, while long positions jumped by 4,898 to 66,891, bringing the negative value of the non-commercial net position up to -21,416 compared to the previous reading of -19,795. The weekly closing price declined to 1.2112 from 1.2181.
Indicator signals:
Moving Averages
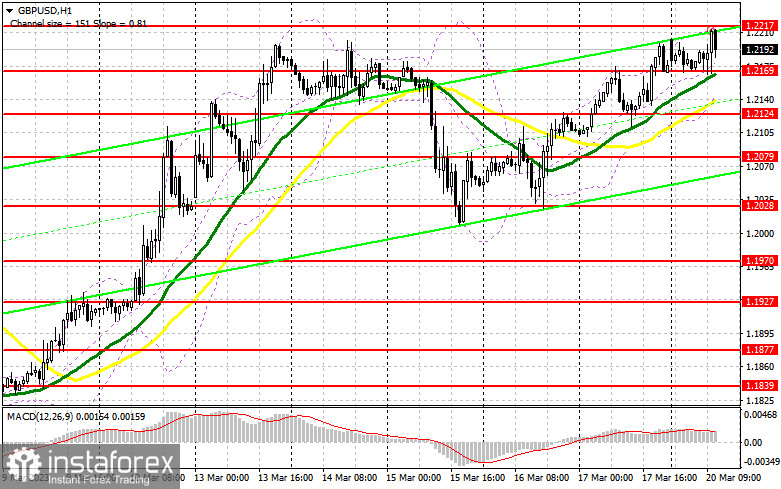
Trading above the 30- and 50-day moving averages indicates a further possible rise in the pound
Please note that the time period and levels of the moving averages are analyzed only for the H1 chart, which differs from the general definition of the classic daily moving averages on the D1 chart.
Bollinger Bands
If the pair advances, the upper band of the indicator at 1.2217 will serve as resistance.
Description of indicators:
• A moving average of a 50-day period determines the current trend by smoothing volatility and noise; marked in yellow on the chart;
• A moving average of a 30-day period determines the current trend by smoothing volatility and noise; marked in green on the chart;
• MACD Indicator (Moving Average Convergence/Divergence) Fast EMA with a 12-day period; Slow EMA with a 26-day period. SMA with a 9-day period;
• Bollinger Bands: 20-day period;
• Non-commercial traders are speculators such as individual traders, hedge funds, and large institutions who use the futures market for speculative purposes and meet certain requirements;
• Long non-commercial positions represent the total number of long positions opened by non-commercial traders;
• Short non-commercial positions represent the total number of short positions opened by non-commercial traders;
• The non-commercial net position is the difference between short and long positions of non-commercial traders.