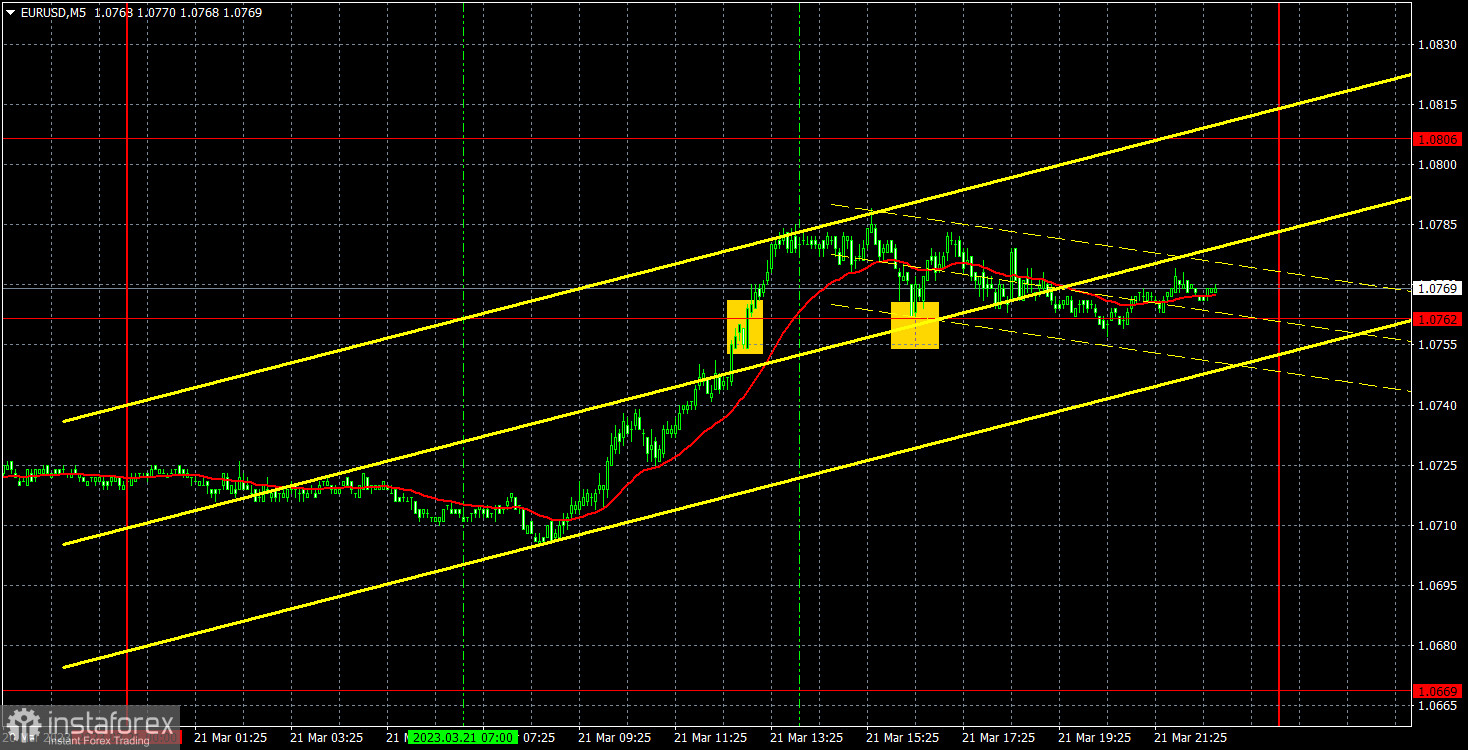
5M chart of EUR/USD
On Tuesday, EUR/USD showed growth again. As we have already said in other articles, you can find reasons for the euro's growth. It is not the fact that they really had an effect on the market, but they could have, and this is the most important thing. European Central Bank President Christine Lagarde delivered another speech, but she repeated the same points she made on Monday. The market is already prepared and focused on the forthcoming Federal Reserve meeting. The euro could also rise based on this simple fact. If the market expects that the Fed rate will not increase at the end of March, the dollar sell-off is quite logical. And at the same time, the pair has been moving up or down or in a "swing" state for quite a long time. In particular, upwards.
Speaking of trading signals, they weren't the best. The first buy signal was formed when the upward movement was almost over. Nevertheless, neither the first nor the second signal could lead to a loss, because the price has not fallen below 1.0762. Therefore, either Stop Loss is at breakeven, or a small profit.
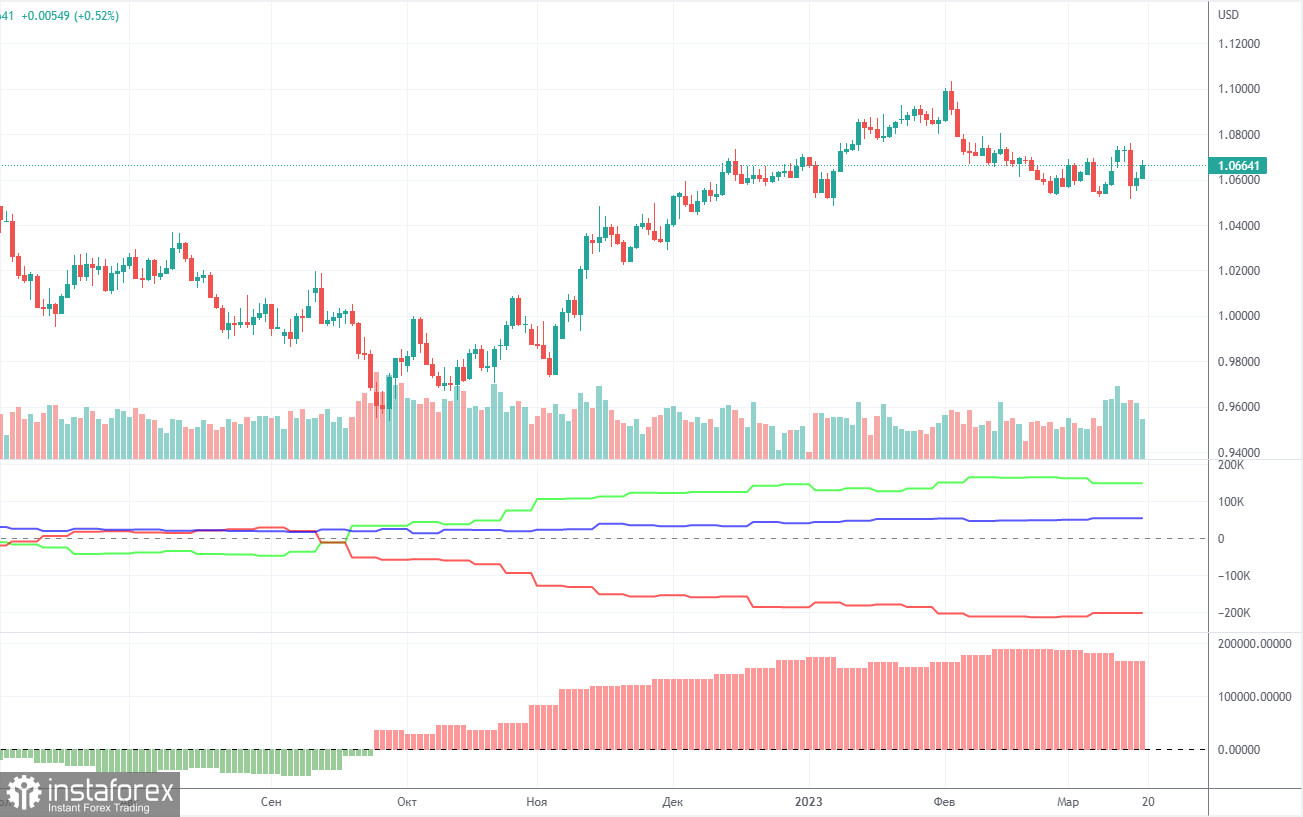
COT report:
On Friday, the new COT report for March 7 was released. The Commodity Futures Trading Commission is slowly catching up with the lost time and publishes reports that have a frequency of two weeks. At this rate, in a couple of weeks we will get the actual data again. So far, we can say that in the last few months, the overall picture has been corresponding to the market situation. On the chart above, we see that the net non-commercial position of large traders (second indicator) has risen since September 2022. At about the same time, the euro started to rise. The net non-commercial position is bullish and only started to fall during the last couple of weeks, which coincides with the euro's decline. I have already drawn your attention to the fact that a fairly high value of the "net position" allows us to expect the uptrend to stop shortly. Such a signal comes from the first indicator, with the green line and the red line being far apart, which is usually a sign of the end of a trend. The euro has already started to fall, but we don't know if it's just a bearish correction or a new downtrend. According to the latest report, non-commercial traders closed 6,900 long positions, while the number of short ones increased by 6,900. Consequently, the net position fell by 13,800. The number of long positions exceeds that of short ones by 148,000. In any case, a correction has been looming for a long time. Therefore, even without reports, it is clear that the downtrend will continue.
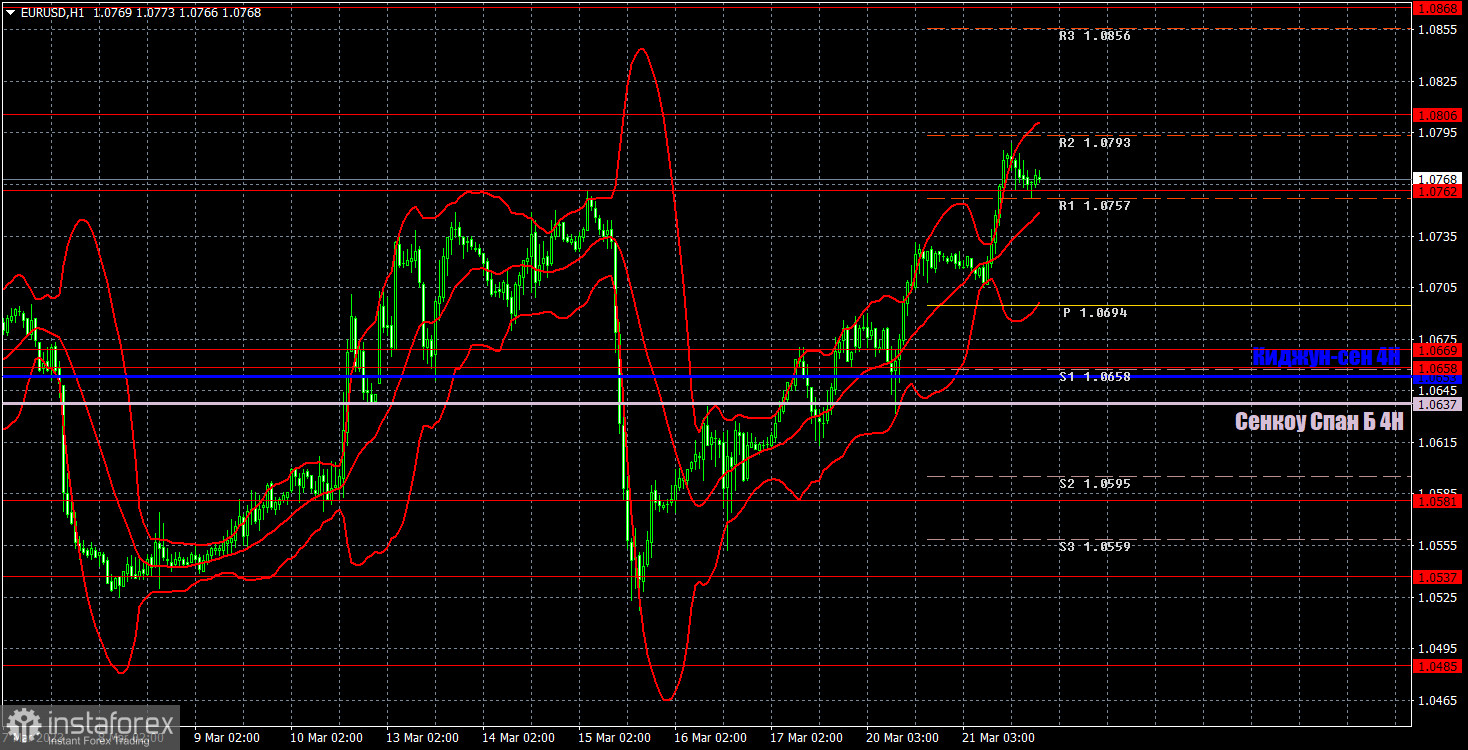
1H chart of EUR/USD
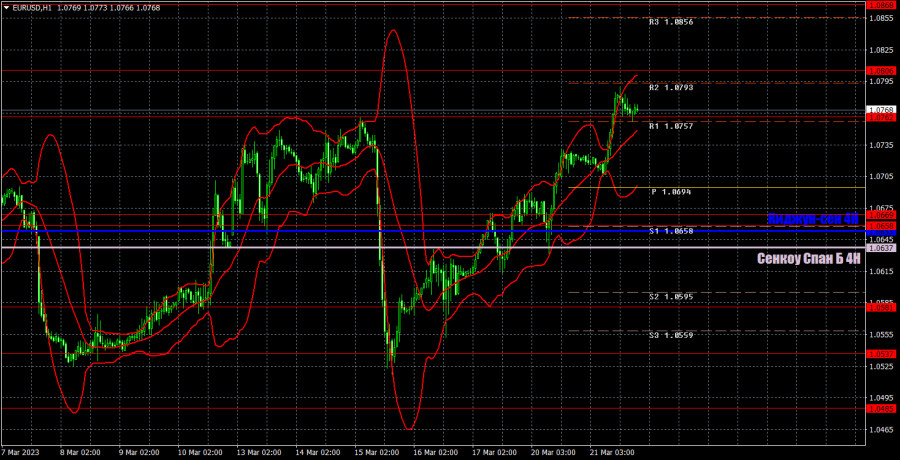
On the one-hour chart, EUR/USD continues to trade in a "swing" mode and has reached the important level of 1.0762, where the last growth spiral ended. The Kijun-Sen and Senkou-Span B lines have converged, which is the best evidence of a flat. Therefore, when you open any positions using any signals, you should take into consideration the fact that not only could there be a flat, but also a swing. The pair could easily fall by 300-350 points today. On Wednesday, important levels are seen at 1.0485, 1.0537, 1.0581, 1.0658-1.0669, 1.0762, 1.0806, 1.0868, 1.0938, 1.1033, and also Senkou Span B (1.0637) and Kijun Sen (1.0653) lines. Ichimoku indicator lines can move intraday, which should be taken into account when determining trading signals. There are also support and resistance although no signals are made near these levels. They could be made when the price either breaks or rebounds from these extreme levels. Do not forget to place Stop Loss at the breakeven point when the price goes by 15 pips in the right direction. In case of a false breakout, it could save you from possible losses. On March 22, Lagarde will give another speech in the European Union, which is unlikely to be any different from yesterday's. In the US, the event we have all been waiting for - the Federal Reserve meeting. Naturally, it will occupy traders' minds in the first place.
Indicators on charts:
Resistance/support - thick red lines, near which the trend may stop. They do not make trading signals.
Kijun-sen and Senkou Span B are the Ichimoku indicator lines moved to the hourly timeframe from the 4-hour timeframe. They are also strong lines.
Extreme levels are thin red lines, from which the price used to bounce earlier. They can produce trading signals.
Yellow lines are trend lines, trend channels, and any other technical patterns.
Indicator 1 on the COT chart is the size of the net position of each trader category.
Indicator 2 on the COT chart is the size of the net position for the Non-commercial group of traders.