Analyzing Wednesday's trades:
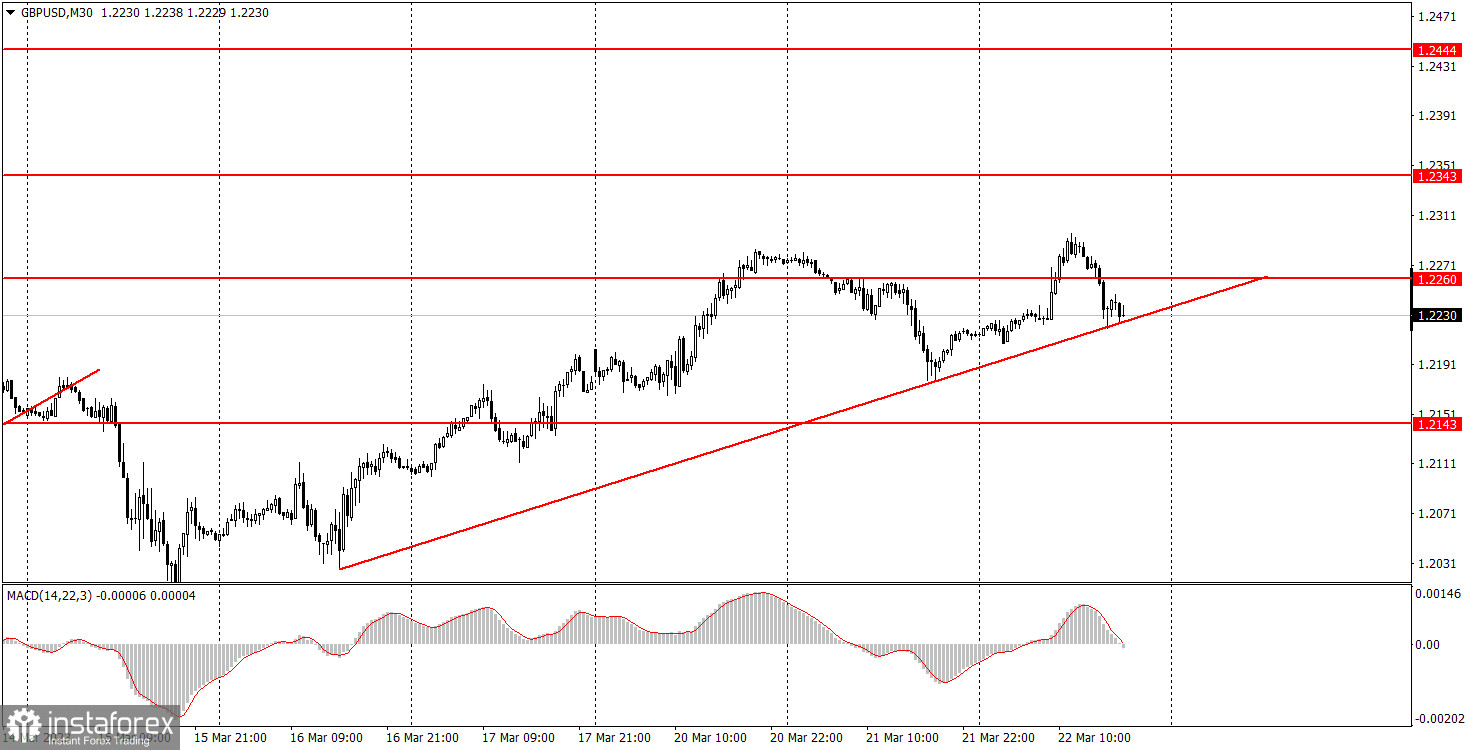
GBP/USD on 30M chart
On Wednesday, GBP/USD managed to rise and fall during the day and maintain its uptrend. We have formed a new ascending trend line, but we have reason to believe that it is not going to be relevant for a long time: the Federal Reserve will announce the results of its meeting, and the Bank of England will hold its own meeting on Thursday. Therefore, volatility may rise sharply and the movements may be absolutely random. Nevertheless, there was important news for the pound as well. In particular, the UK published its inflation report for February, which discouraged many market participants. Although the reaction to this report wasn't necessarily strong (the pound rose by 60 points), it wasn't weak either. And inflation rose to 10.4% instead of falling to 9.7-9.9%. The British pound can keep rising for a while, because it is already obvious that the growth rate of the BoE rate simply can't keep up with the inflation rate. The BoE's actions are only holding back inflation from rising even more, which could already be 20% if the rate had remained at zero, as it was a year and a half ago.
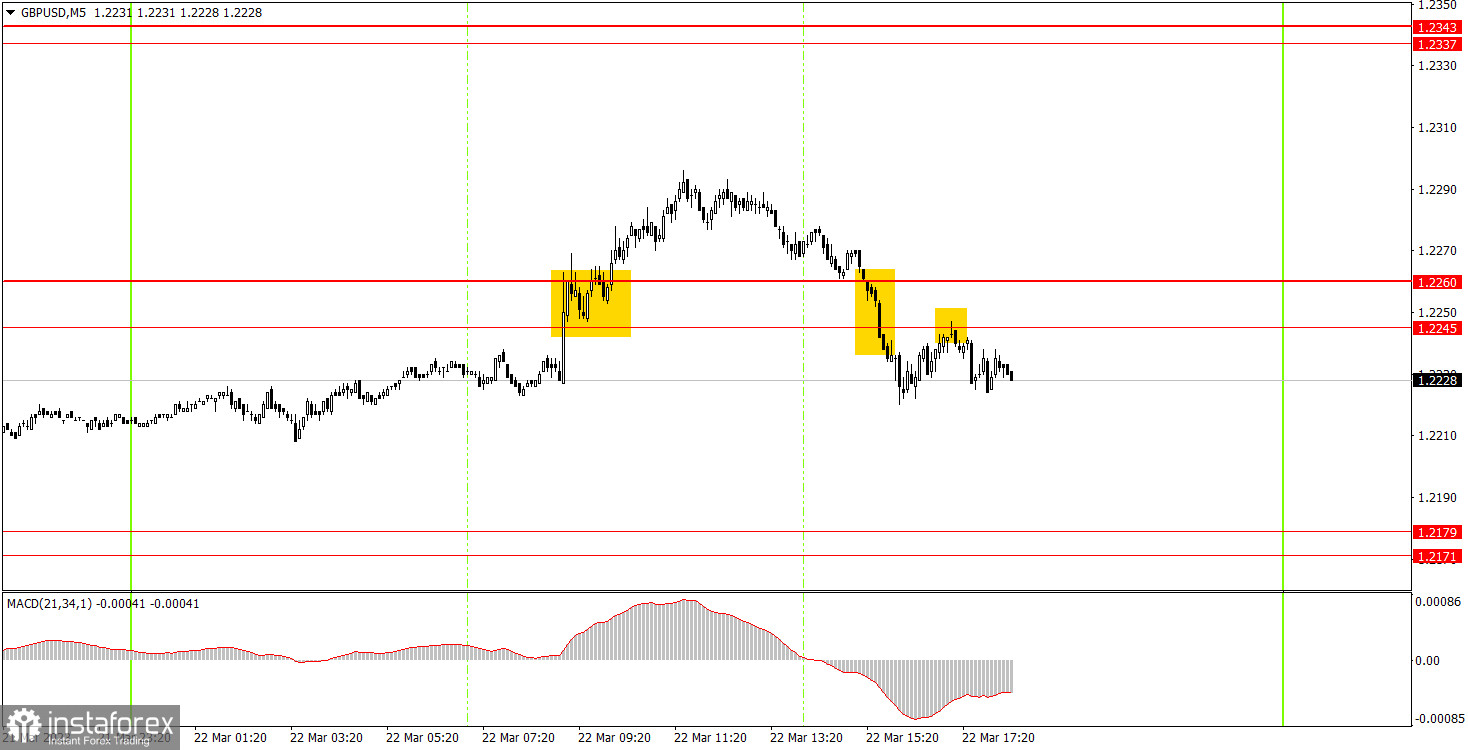
GBP/USD on 5M chart
Three trading signals were formed on the 5-minute chart. At first, the pair overcame the 1.2245-1.2260 area, and then managed to go up by 25 points. Naturally, it was impossible to gain profit on such a weak movement, but it was possible to place a Stop Loss on Breakeven, which was used to close the position. Then the pair settled below the same area, then went down 15 points, returned to 1.2245, rebounded from it and tried to go down again. But it failed again. As of Wednesday evening, this trade could also be closed manually with zero profit. Therefore, it was not profitable, but not unprofitable either, and all the most interesting events and movements are just ahead.
Trading tips on Thursday:
On the 30-minute chart, GBP/USD continues to trade on the classic "swing", but in the long term. The Fed held its meeting on Wednesday, while the BoE will announce its rate decision on Thursday. Thus, remember that the succeeding movements may be absolutely random and strong. On the 5-minute chart, it is recommended to trade at the levels 1.1924, 1.1992-1.2008, 1.2065-1.2079, 1.2143, 1.2171-1.2179, 1.2245-1.2260, 1.2337-1.2343, 1.2387, 1.2444-1.2471. As soon as the price passes 20 pips in the right direction, you should set a Stop Loss to breakeven. On Thursday, in the UK, the BoE will announce its decision, while in the US, there are no interesting events. Nevertheless, all market participants will consider two meetings at once, so we expect volatile movements.
Basic rules of the trading system:
1) The strength of the signal is determined by the time it took the signal to form (a rebound or a breakout of the level). The quicker it is formed, the stronger the signal is.
2) If two or more positions were opened near a certain level based on a false signal (which did not trigger a Take Profit or test the nearest target level), then all subsequent signals at this level should be ignored.
3) When trading flat, a pair can form multiple false signals or not form them at all. In any case, it is better to stop trading at the first sign of a flat movement.
4) Trades should be opened in the period between the start of the European session and the middle of the US trading hours when all positions must be closed manually.
5) You can trade using signals from the MACD indicator on the 30-minute time frame only amid strong volatility and a clear trend that should be confirmed by a trendline or a trend channel.
6) If two levels are located too close to each other (from 5 to 15 pips), they should be considered support and resistance levels.
On the chart:
Support and Resistance levels are the levels that serve as targets when buying or selling the pair. You can place Take Profit near these levels.
Red lines are channels or trend lines that display the current trend and show in which direction it is better to trade now.
The MACD indicator (14, 22, and 3) consists of a histogram and a signal line. When they cross, this is a signal to enter the market. It is recommended to use this indicator in combination with trend patterns (channels and trendlines).
Important announcements and economic reports that can be found on the economic calendar can seriously influence the trajectory of a currency pair. Therefore, at the time of their release, we recommend trading as carefully as possible or exiting the market in order to avoid sharp price fluctuations.
Beginners on Forex should remember that not every single trade has to be profitable. The development of a clear strategy and money management is the key to success in trading over a long period of time.