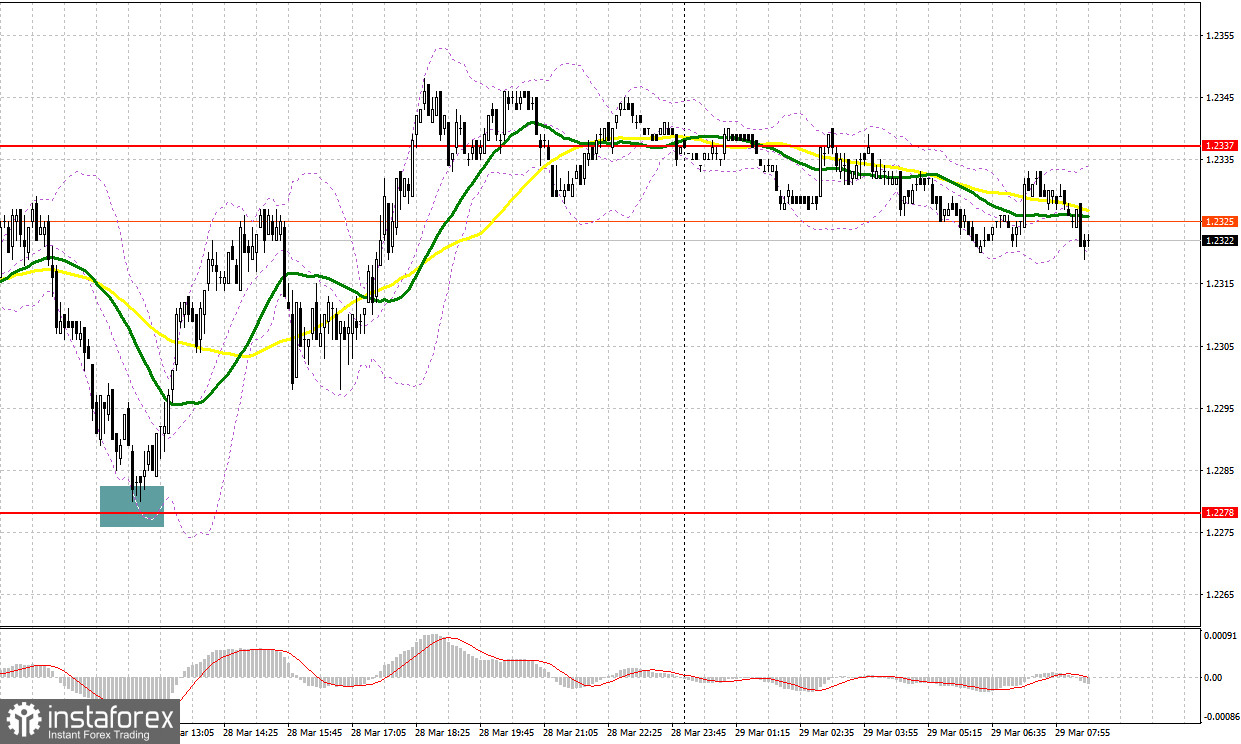
Yesterday, there was only one entry point. Now, let's look at the 5-minute chart and figure out what actually happened. In my morning article, I turned your attention to 1.2278 and recommended making decisions with this level in focus. The pair declined to 1.2278. However, it lacked just a few pips for a test of this level. Hence, there was no buy signal. In the afternoon, I did not see new signals.
When to open long positions on GBP/USD:
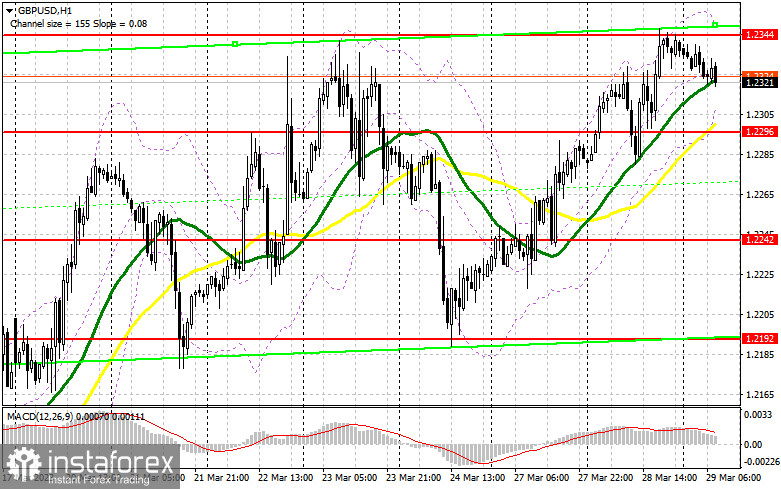
Today, the UK will unveil a batch of macro stats, namely the M4 money supply, mortgage approvals, and net lending to individuals. However, they will hardly have a big impact on the trajectory of the pair. Besides, traders are anticipating monetary policy summary and minutes of the BoE. Although the regulator does not intend to take a pause in the monetary tightening in the near future, any hints of such a possibility may weaken the pound sterling in the short term. For this reason, I would advise you not to rush into purchases, especially at monthly highs. It is better to buy the pair after a decline and a false breakout of the support level of 1.2296. Above this level, the moving averages are passing in positive territory. In this case, the pair could reach a new monthly high of 1.2344. After consolidation and a downward retest of this level, GBP/USD may rise to 1.2395. It will be rather hard for the bulls to push the pair above this level. A breakout of this level could trigger a jump to 1.2443 where I recommend locking in profits. If the bulls fail to push the pair to 1.2296, the pressure on the pound will return. It could lead to a downward correction to the lower border of the sideways channel. In this case, I would advise you to postpone long positions until a false breakout of 1.2242. You could buy GBP/USD at a bounce from a high of 1.2192, keeping in mind an intraday upward correction of 30-35 pips.
When to open short positions on GBP/USD:
Sellers need to assert themselves if they want to see the formation of a double-top pattern and a larger drop after the bullish trend in March. Only a false breakout of the monthly high of 1.2344 may give excellent entry points into short positions against the trend. GBP/USD may fall to the support level of 1.2296 where buyers are likely to enter the market. A breakout and an upward retest of this level will increase the pressure on the pound sterling, providing a sell signal with a drop to 1.2242, the lower border of the sideways channel. A more distant target is located at 1.2192. The pair may decrease to it only in the case of the release of the BoE dovish meeting minutes. If GBP/USD rises and bears show no energy at 1.2344, which is more likely, the bulls will be in control. The pound sterling may reach a new high of 1.2395. Only a false breakout of this level will give an entry point into short positions. If there is no downward movement, you could sell GBP/USD at a bounce from 1.2443, keeping in mind an upward intraday correction of 30-35 pips.
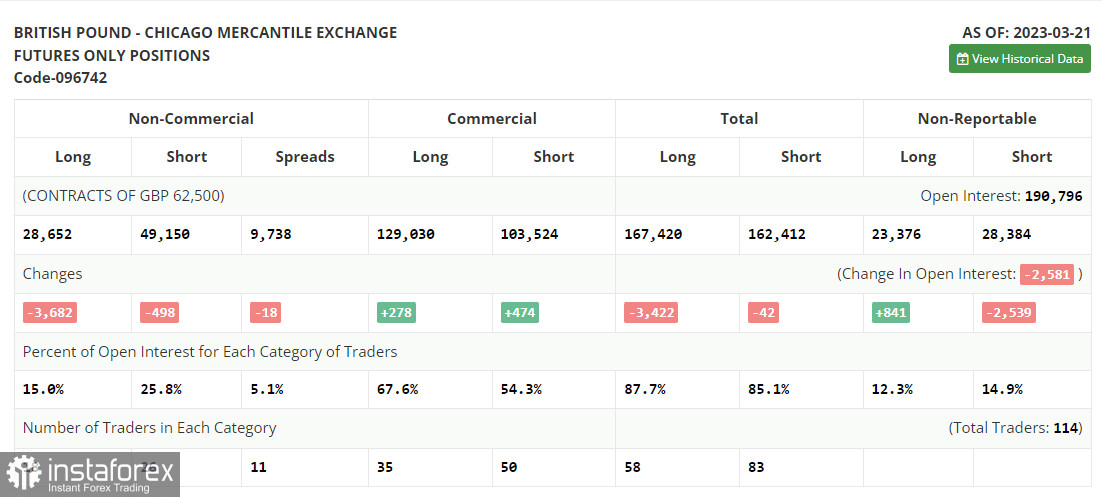
COT report
According to the COT report for March 21, there was a drop in both long and short positions. The March meeting of the Bank of England did not bring any surprises. As widely expected, the regulator raised the interest rate, hinting at further monetary tightening. this is hardly surprising given that inflation in the UK remains high. Judging by the latest data, consumer prices rose in February, forcing the regulator to stock a hawkish stance. Given that many expect a pause in the monetary tightening by the Fed, the pound sterling could maintain its upward movement. The latest COT report showed that short non-commercial positions decreased by 498 to 49,150, while long non-commercial positions declined by 3,682 to 28,652. It led to an increase in the negative delta of the non-commercial net position to -20,498 versus -17,314 a week earlier. The weekly closing price climbed to 1.2241 against 1.2199.
Indicators' signals:
Trading is carried out near the 30 and 50 daily moving averages, which indicates the possibility of a correction.
Moving averages
Note: The period and prices of moving averages are considered by the author on the H1 (1-hour) chart and differ from the general definition of the classic daily moving averages on the daily D1 chart.
Bollinger Bands
If GBP/USD declines, the indicator's lower border at 1.2310 will serve as support.
Description of indicators
- Moving average (moving average, determines the current trend by smoothing out volatility and noise). Period 50. It is marked yellow on the chart.
- Moving average (moving average, determines the current trend by smoothing out volatility and noise). Period 30. It is marked green on the chart.
- MACD indicator (Moving Average Convergence/Divergence - convergence/divergence of moving averages) Quick EMA period 12. Slow EMA period to 26. SMA period 9
- Bollinger Bands (Bollinger Bands). Period 20
- Non-commercial speculative traders, such as individual traders, hedge funds, and large institutions that use the futures market for speculative purposes and meet certain requirements.
- Long non-commercial positions represent the total long open position of non-commercial traders.
- Short non-commercial positions represent the total short open position of non-commercial traders.
- Total non-commercial net position is the difference between the short and long positions of non-commercial traders.