Analysis of GBP/USD 5M
Instead of rising, GBP/USD extended losses on Tuesday, as UK data exerted pressure on the pair. Reports on wages, unemployment, and unemployment claims were supposed to be published, but only a report on wages was released. UK wages remained strong, which is in clear contrast to Huw Pill's words about declining wages. So far we have only seen strong growth, which has a negative impact on inflation. The Bank of England, which halted its run of interest rate hikes at its last meeting, has made it clear that it is no longer ready to raise interest rates at every meeting. Therefore, rising wages and potentially high inflation are negative factors for the British currency.
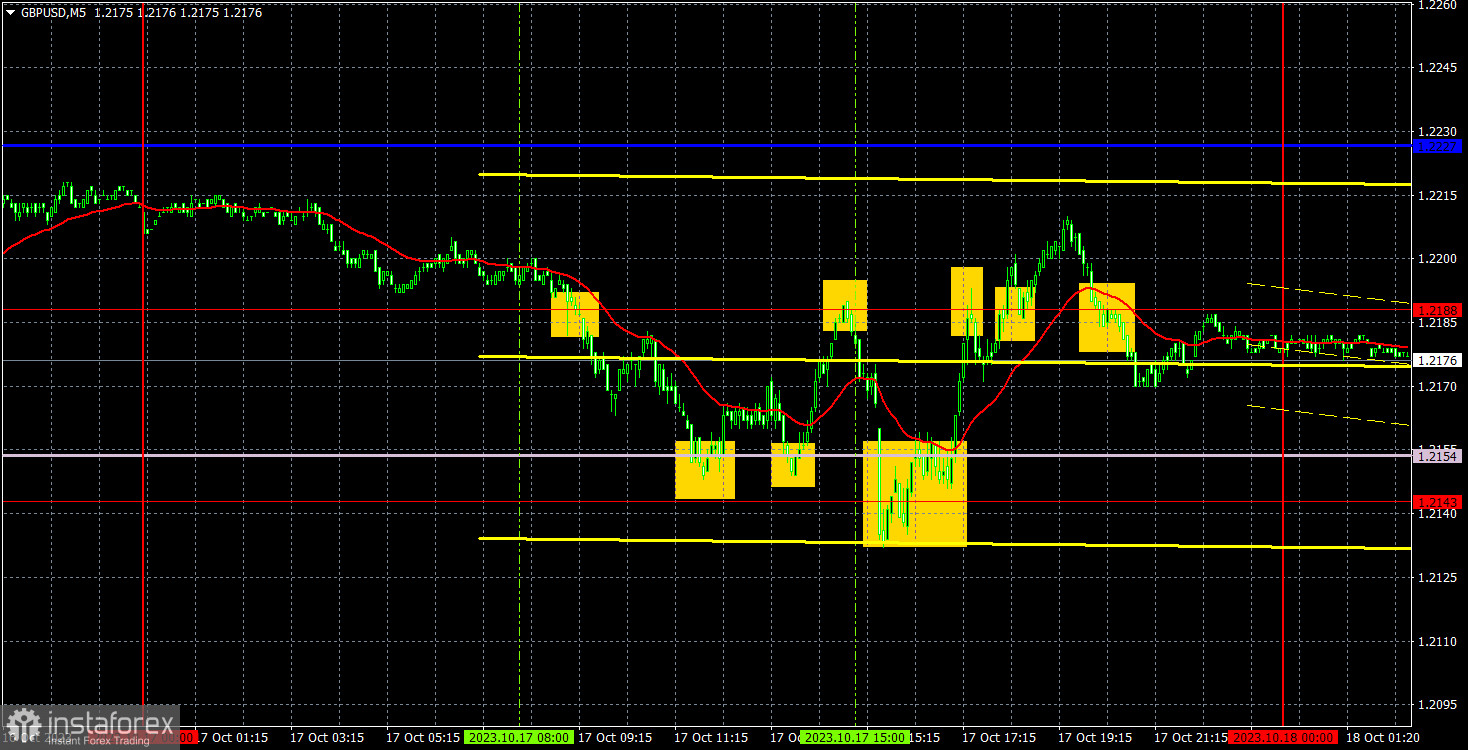
Several trading signals were formed yesterday. In general, the pair spent the whole day between the range of 1.2143-1.2154 and the level of 1.2188. So traders could only trade between these areas. All signals were generally identical, so we won't analyze each one. On average, each trade could have yielded 15 pips in profit, totaling about 60 pips in profit, and all the signals turned out to be correct. Trading within a limited range is not convenient, but there was no other choice.
COT report:
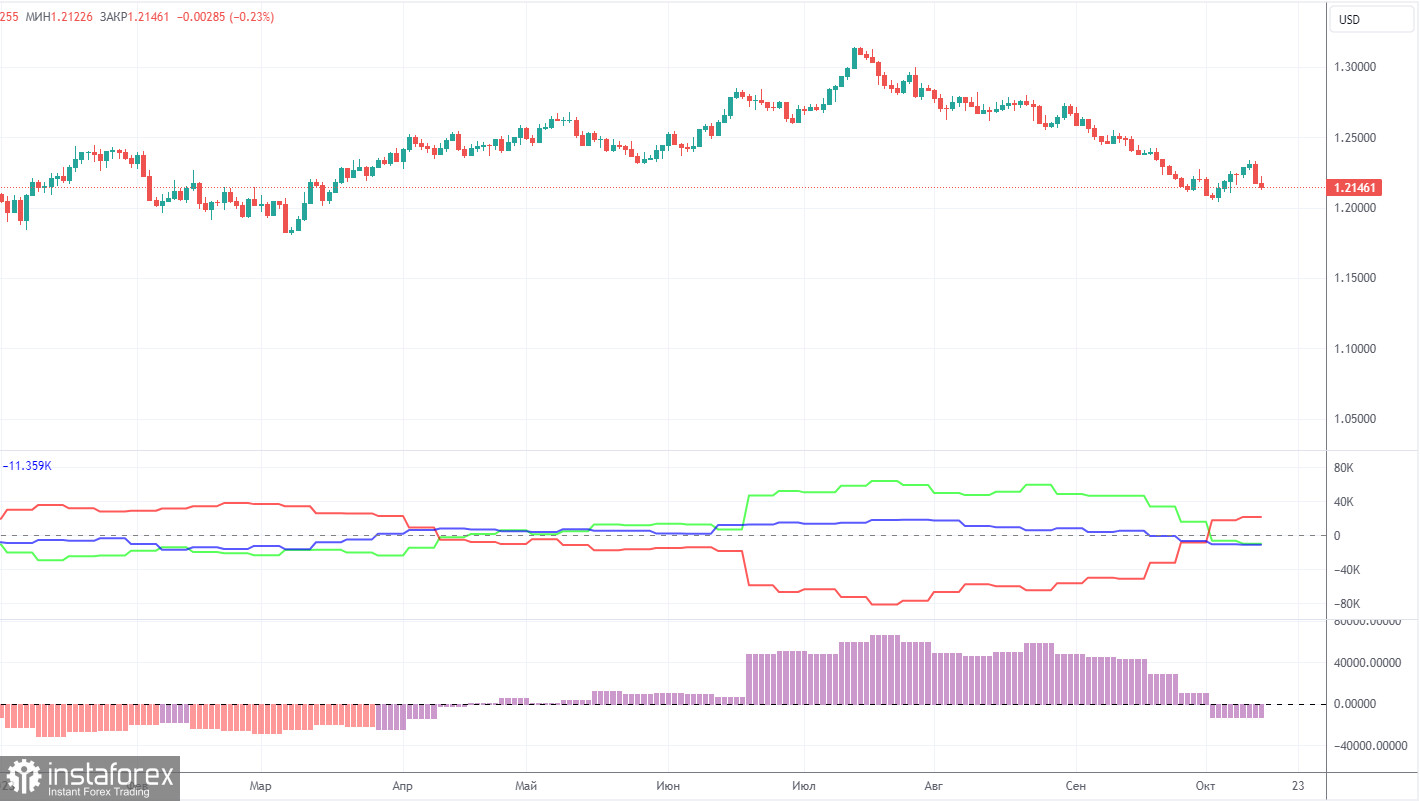
COT reports on the British pound also align perfectly with what's happening in the market. According to the latest report on GBP/USD, the non-commercial group closed 7,600 long positions and 4,200 short ones. Thus, the net position of non-commercial traders decreased by another 3,400 contracts in a week. The net position indicator has been steadily rising over the past 12 months, but it has been firmly decreasing over the past two months. The British pound is also losing ground. We have been waiting for many months for the sterling to reverse downwards. Perhaps GBP/USD is at the very beginning of a prolonged downtrend. At least in the coming months, we do not see significant prospects for the pound to rise, and even if we're currently witnessing a corrective phase, it could persist for several months.
The British pound has surged by a total of 2,800 pips from its absolute lows reached last year, which is an enormous increase. Without a strong downward correction, a further upward trend would be entirely illogical (if it is even planned). We don't rule out an extension of an uptrend. We simply believe that a substantial correction is needed first, and then we should assess the factors supporting the US dollar and the British pound. A correction to the level of 1.1844 would be enough to establish a fair balance between the two currencies. The non-commercial group currently holds a total of 66,300 longs and 76,300 shorts. The bears have been holding the upper hand in recent months, and we believe this trend will continue in the near future.
Analysis of GBP/USD 1H
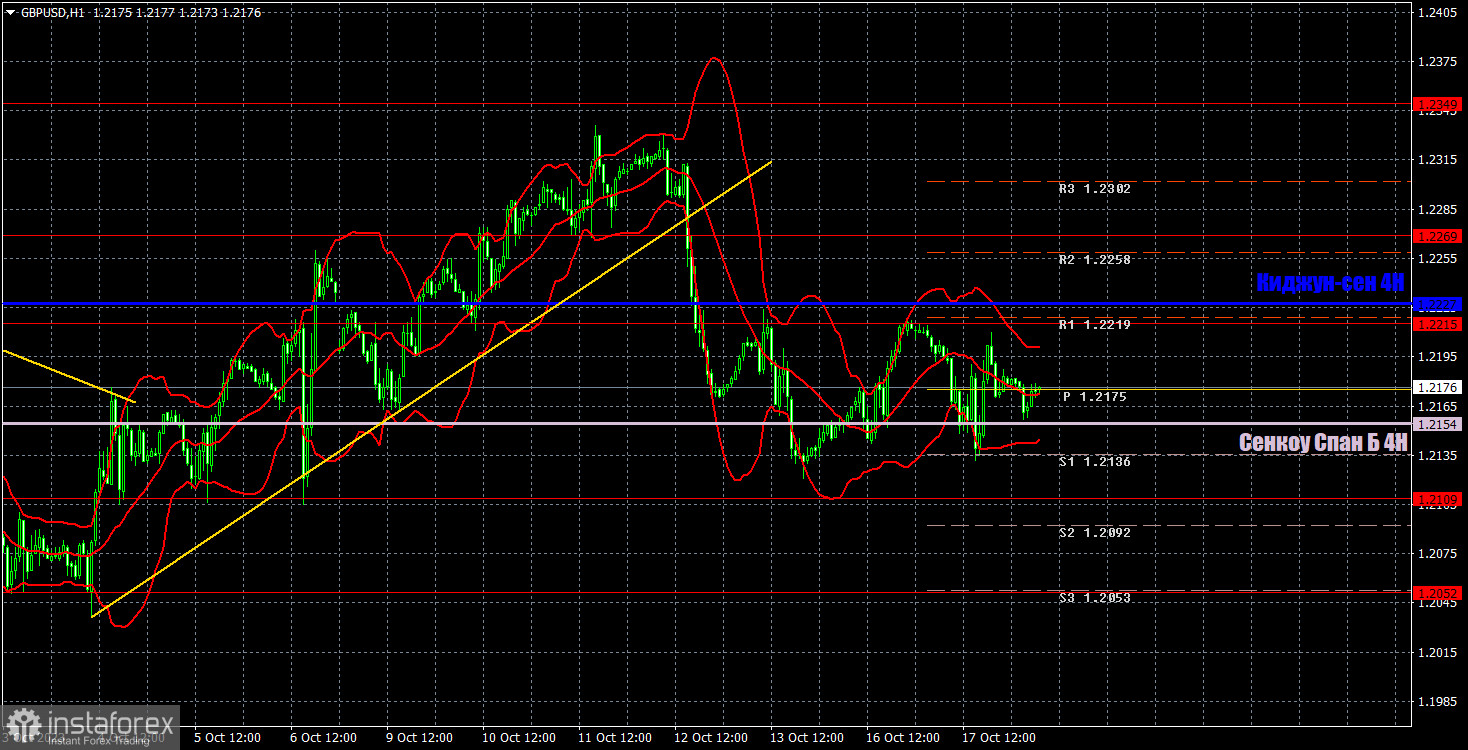
On the 1H chart, GBP/USD settled below the ascending trendline but could still correct higher. We have repeatedly mentioned that we are expecting a stronger correction, which is still possible. Take note that the pair managed to stay above the Senkou Span B line, making it possible for it to return to the last local high at 1.2330.
As of October 18, we highlight the following important levels: 1.1760, 1.1874, 1.1927-1.1965, 1.2052, 1.2109, 1.2215, 1.2269, 1.2349, 1.2429-1.2445, 1.2520, 1.2605-1.2620, and 1.2693. The Senkou Span B (1.2154) and Kijun-sen (1.2227) lines can also be sources of signals. Signals can be "bounces" and "breakouts" of these levels and lines. It is recommended to set the Stop Loss level to break-even when the price moves in the right direction by 20 pips. The Ichimoku indicator lines can move during the day, which should be taken into account when determining trading signals. The illustration also includes support and resistance levels that can be used to lock in profits from trades.
On Wednesday, a pivotal inflation report for September will be released in the UK. In the US, a less critical report on building permit issuances will be published. The British report will be released early in the morning, so it is likely to set the tone for trading throughout the day.
Description of the chart:
Support and resistance levels are thick red lines near which the trend may end. They do not provide trading signals;
The Kijun-sen and Senkou Span B lines are the lines of the Ichimoku indicator, plotted to the 1H timeframe from the 4H one. They provide trading signals;
Extreme levels are thin red lines from which the price bounced earlier. They provide trading signals;
Yellow lines are trend lines, trend channels, and any other technical patterns;
Indicator 1 on the COT charts is the net position size for each category of traders;
Indicator 2 on the COT charts is the net position size for the Non-commercial group.