Trading plan for 21/04/2017:
The market is tradng with low volatility, no important data was published at night. The third day in a row, EUR/USD will begin the European session from 1.0720 level. USD/JPY rebounded above 109.00. The market is waiting for the first round of the French presidential election. The announcement of the reform of the tax system by the Trump administration, coupled with the good results of the companies, has bolstered the Wall Street index (Nasdaq has reached the highest levels in history). In Asia, a positive sentiment is seen first of all on the Tokyo exchange, where the Nikkei 225 is up 0.8%. WTI oil after Wednesday's fall is not able to permanently return over $51 per barrel and the ounce of gold is valued at $1,280.
On Friday 21st of April, the event calendar is busy with macroeconomic data from the Eurozone (Flash Manufacturing, Services, and Composite PMI's), Great Britain (Retail Sales with Auto Fuel), Canada (Consumer Price Index) and the USA (Flash Manufacturing, Services, and Composite PMI's and Existing Home Sales).
EUR/USD analysis for 21/04/2017:
The bunch of PMI data from France, Germany, and Eurozone is scheduled for release from 07:00 am to 09:00 am GMT. The most important reading will be the Eurozone Composite PMI, which is expected at the level of 56.4, unchanged from a month ago. This is still the highest reading since the second quarter of 2011 – a six-year high. Many market participants see the high readings as a good sign. Interestingly, the previous highs in PMI Composite were right before the 2000 stock market peak, then in 2007 before the financial crisis and later in 2011 when the euro crisis was about to start.
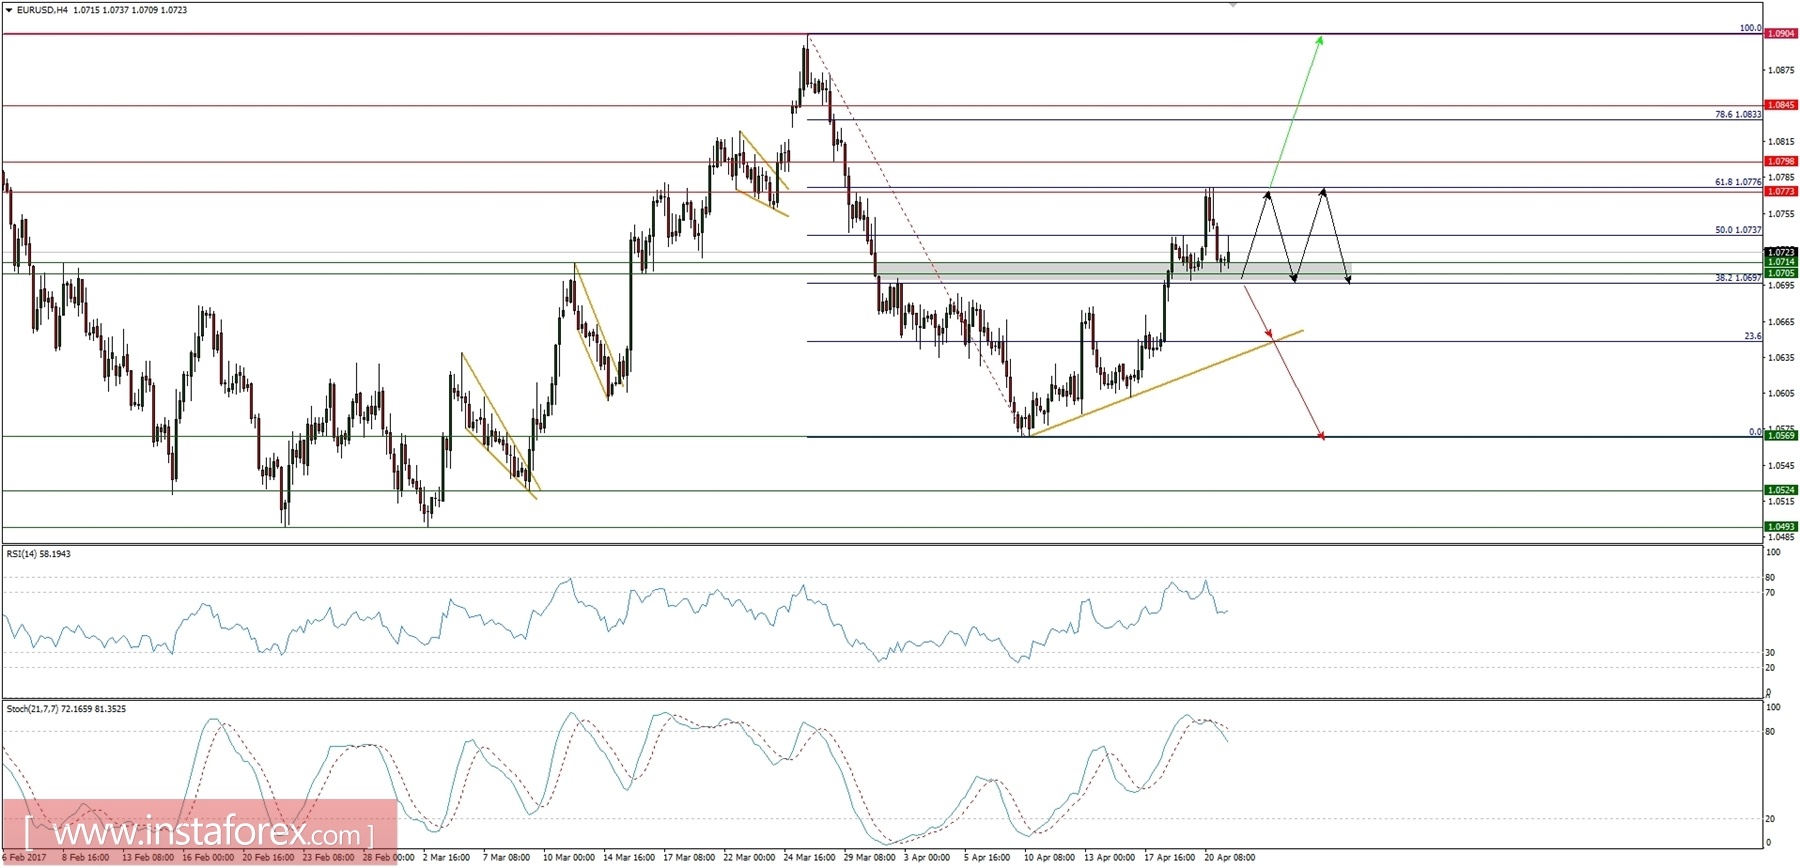
Let's now take a look at the EUR/USD technical picture at the H4 timeframe. The market is in the final stretch before the first round of the presidential elections in France over the weekend, so only a very bad data would flatten the positive sentiment. The price, however, reversed from the 61%Fibo at the level of 1.0776 and now got back to the previous technical support zone at the level of 1.0705. There is a high possibility that the market will be trading sideways today as the biggest risk will come from the results of the French election and those will be known late on Sunday. The next support is seen at the level of 1.0569 and the next important technical resistance is seen at the level of 1.0904.
GBP/USD analysis for 21/04/2017:
The Retail Sales with Auto Fuel data are scheduled for release at 08:30 am GMT and market participants expect a moderate -0.3% decline after a 1.4% increase last month. On a yearly basis, the sales decline should reach 0.4%, from 3.7% to 3.3%. The expectations are that the overall economic activity will decline slightly on monthly basis, but still looks pretty decent on the yearly basis - no real impact of the Brexit event in the data yet.
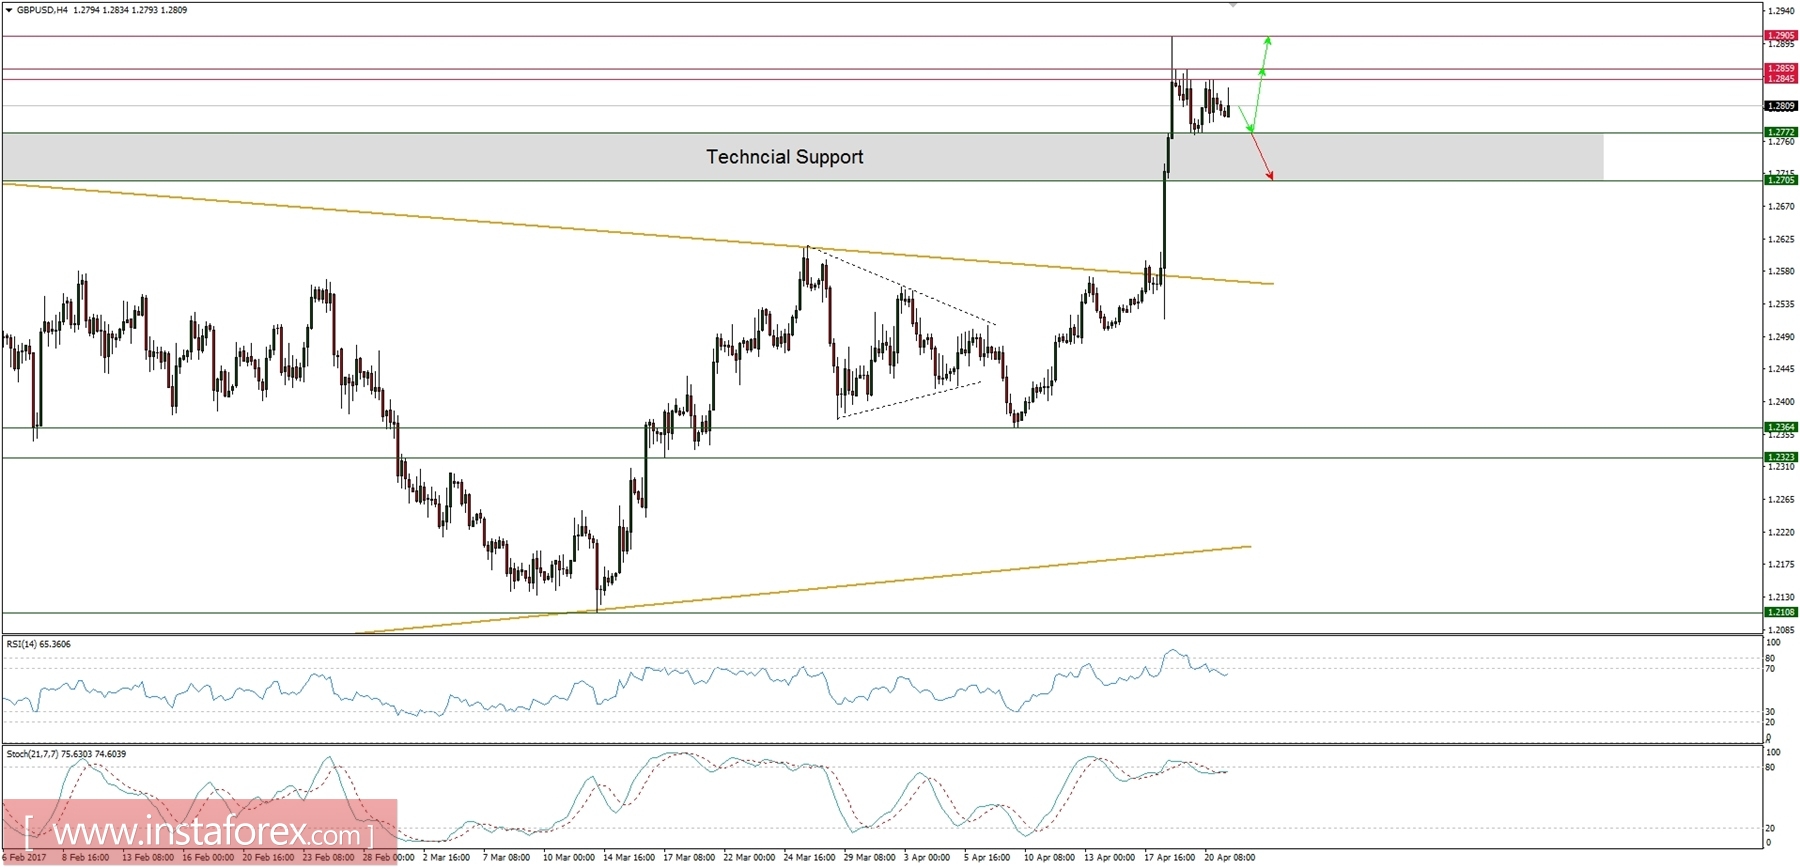
Let's now take a look at the GBP/USD technical picture at the H4 timeframe. The price is still consolidating the gains above the technical support at the level of 1.2772, but the market conditions look overbought. Nevertheless, as long as the technical support is not clearly violated the bias remains bullish. The next resistance is seen at the levels of 1.2845, 12856, and 12905.
USD/CAD analysis for 21/04/2017:
The Consumer Price Index data are scheduled for release at 12:30 pm GMT and market participants expect a slight sign of inflationary pressure. The CPI Index is expected to increase from 0.2% to 0.4% on a monthly basis and the Core CPI should beat the previous 0.4% reading. The CPI Index is the key gauge for inflation in Canada, so any data better than expected will send a clear message to the Bank of Canada regarding a further interest rate policy (in that case the interest rate hike would be an appropriate response).
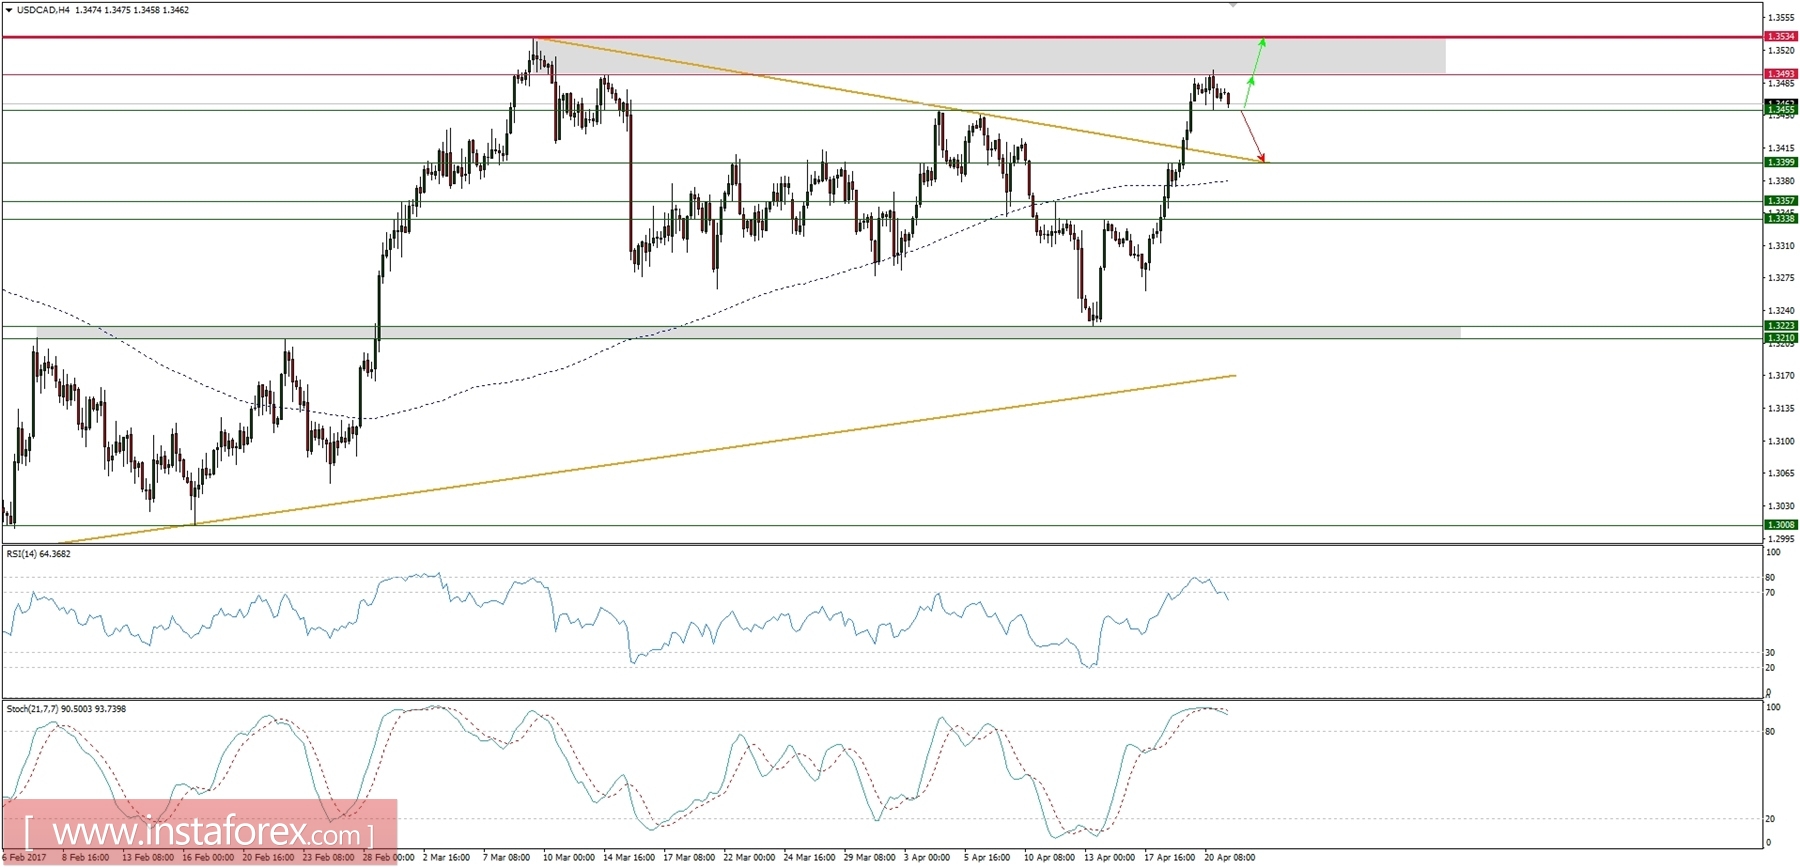
Let's now take a look at the USD/CAD technical picture at the H4 time frame. The price is trading just below the important technical resistance at the level of 1.3534 in overbought market conditions. There is still no negative divergence between the price and the momentum oscillator, so it is still possible for the price to try to test that level. The next support is seen at the levels of 1.3455 and 1.3400.
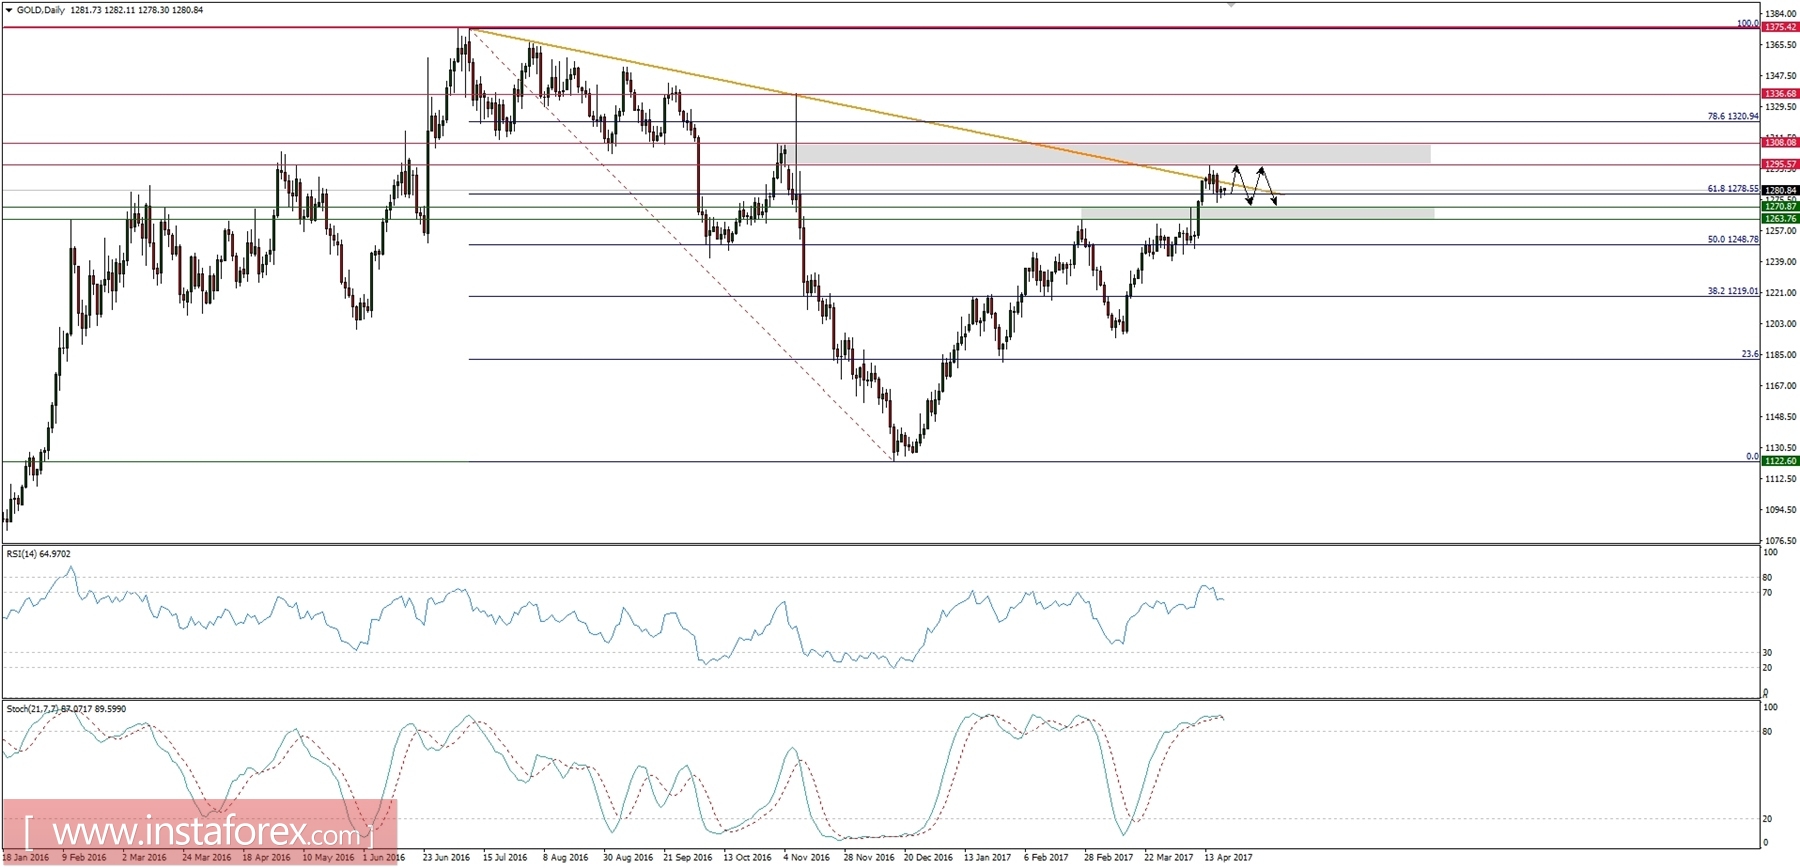
Market snapshot: Gold consolidating gains around 61%Fibo
The price of the yellow metal still does not want to go down despite the overbought market conditions in the daily time frame. The initial breakout above the golden trend line was a fake one, but bulls have managed to bounce from the nearest support at the level of $1,271. Currently, gold is expected to trade inside of the trading range between the levels of $1,270 - $1,263 and $1,295 - $1,308.