GBP/USD 5M
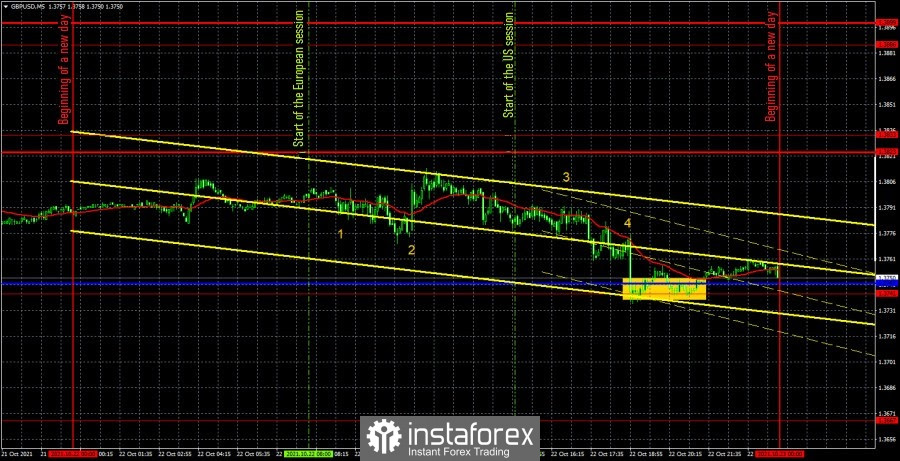
The GBP/USD pair was trading rather weakly on October 22. Friday volatility was only 78 points, which, in principle, is the average value for the pair. Even closer to low. Nevertheless, there were still some movements during the day, but they did not work out, since the only trading signal was formed at the end of the day and was extremely inaccurate. But a fairly large amount of macroeconomic statistics was published during the day. Particularly in the UK. Data on retail sales came out early in the morning, which unexpectedly fell by 1.3% in September, although the markets were expecting an increase of 0.6% m/m. However, this report had no effect on the pair's movement (figure "1" in the chart). A little later, the indexes of business activity in the services and manufacturing sectors for October were published, where the first rose to 58.0 points, and the second to 57.7 points. These two reports triggered a 25-point rise in the British currency (the number "2" in the chart). This was followed by reports on business activity in the United States (figure "3" in the chart), which also had no effect on the mood of traders. And in the end, there was a speech by Federal Reserve Chairman Jerome Powell, in which the markets considered hints of the collapse of the QE program in November, so the dollar rose 35 points. Thus, formally, two events out of four were worked out, but the reaction to them was not strong.
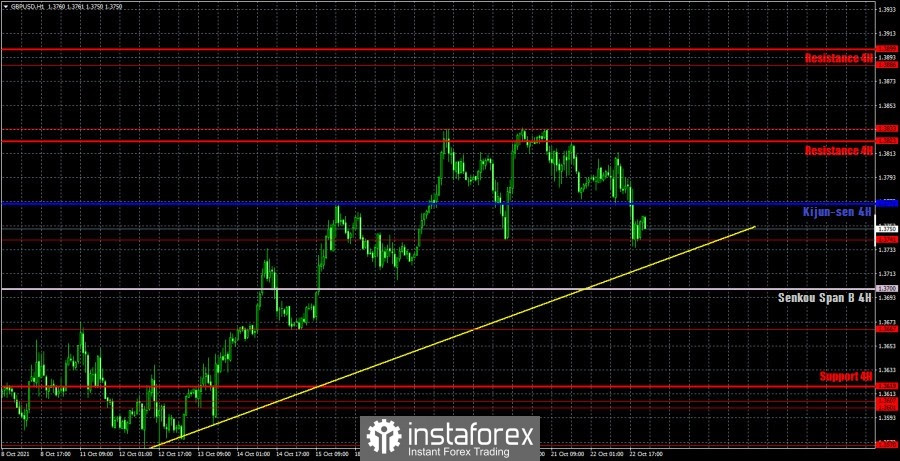
GBP/USD 1H

The pound/dollar pair maintains an upward trend on the hourly timeframe, as it continues to be above the trend line. However, in the past few days, the bulls have not managed to overcome the level of 1.3833, so we are already witnessing the second round of correction against the upward trend. If the bulls manage to keep the pair above the uptrend line, then the price may return to the 1.3833 level and try to overcome it for the fourth time. In any case, the upward trend will continue. However, if the price settles below the trendline, then the upward trend will be disrupted and the chances of a downward move will increase. Especially if the Senkou Span B line is crossed. On the whole, the pound has risen in price quite well over the past weeks, so a correction is now even more preferable. We highlight the following important levels on October 25: 1.3667, 1.3741, 1.3833, 1.3886. Senkou Span B (1.3700) and Kijun-sen (1.3771) lines can also be sources of signals. It is recommended to set the Stop Loss level at breakeven when the price passes in the right direction by 20 points. The Ichimoku indicator lines can move during the day, which should be taken into account when looking for trading signals. Nothing interesting and important is planned in the UK on Monday, and the consumer confidence indicator will be published in the US. Thus, we can assume that there will be no macroeconomic background. Consequently, the volatility of the pair may remain low, unless something unexpected happens.
We recommend you to familiarize yourself:
Overview of the EUR/USD pair. October 25. Jerome Powell did not help the dollar and did not give specifics to the markets
Overview of the GBP/USD pair. October 25. The British are no longer happy with Brexit. Negotiations on the Northern Ireland Protocol will continue
Forecast and trading signals for EUR/USD for October 25. Detailed analysis of the movement of the pair and trade deals.
COT report

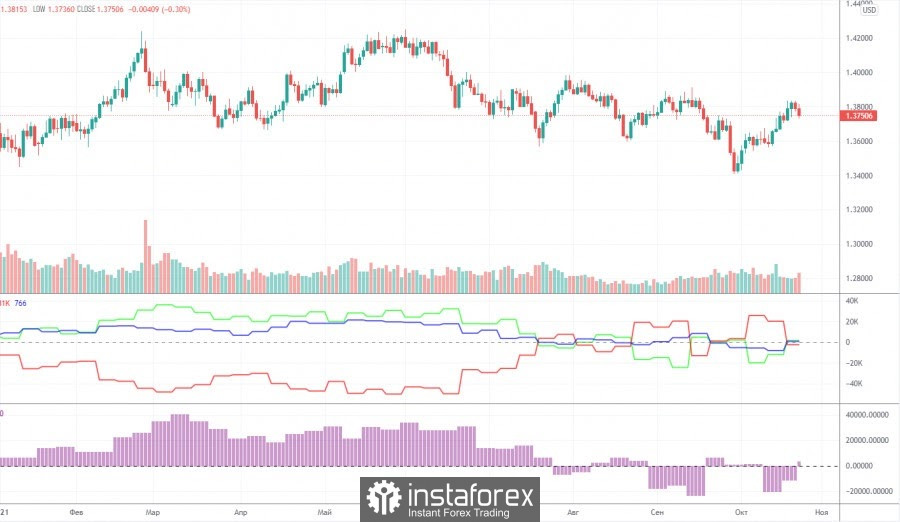
The mood of professional traders became less bearish again during the last reporting week (October 12-18). The situation with the Commitment of Traders (COT) reports is now even more ambiguous than with the technical picture. And if we compare the COT reports for the euro and the pound, then the situation becomes even stranger. Both indicators in the chart above show that large players do not have any clear, precise and understandable mood at the moment. Consequently, now it is simply impossible to make any forecasts based on COT reports. In principle, the chart above clearly shows the entire movement of the pair over the past year. It is rather difficult to call it a trend or even a trend. In the last couple of months, the mood of the big players has been constantly changing. The green and red lines of the first indicator (net positions of groups of traders "commercial" and "non-commercial") are constantly changing the direction of movement. This means that the two largest groups of traders are constantly increasing and decreasing their net positions. During the reporting week, professional traders opened 2,000 buy contracts (longs) and closed 12.5 thousand sell contracts (shorts). Thus, their net position increased by 10.5 thousand contracts. This is in line with what has been happening with the pound in recent weeks (it is rising). Nevertheless, it is impossible to make a long-term forecast, since the net position may fall already by the end of next week. We also pay attention to the fact that the green and red lines of the first indicator are not moving towards each other and are not moving away from each other. Therefore, it is also impossible to talk about any trend now.
Explanations for the chart:
Support and Resistance Levels are the levels that serve as targets when buying or selling the pair. You can place Take Profit near these levels.
Kijun-sen and Senkou Span B lines are lines of the Ichimoku indicator transferred to the hourly timeframe from the 4-hour one.
Support and resistance areas are areas from which the price has repeatedly rebounded off.
Yellow lines are trend lines, trend channels and any other technical patterns.
Indicator 1 on the COT charts is the size of the net position of each category of traders.
Indicator 2 on the COT charts is the size of the net position for the non-commercial group.