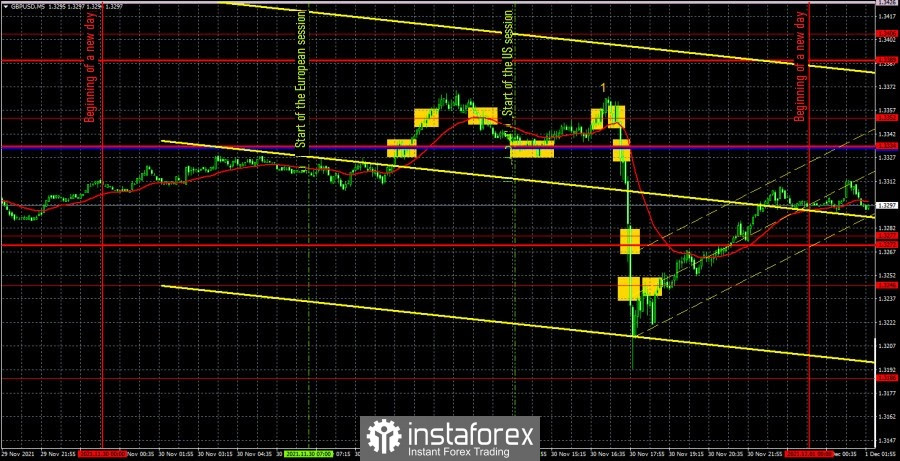
GBP/USD 5M

The GBP/USD pair almost completely repeated the movements of the EUR/USD pair on Tuesday. It is these movements that we mean when we talk about the influence of the same factors on the foreign exchange market. Yesterday, for example, the euro and the pound fell after the speech of Federal Reserve Chairman Jerome Powell began. Janet Yellen gave a speech at the same time. Both officials spoke in the Senate. The day before yesterday there were similar speeches in the Senate, but there was no such strong reaction. Thus, it can be assumed that Powell or Yellen said something, which was followed by massive dollar purchases. It is unlikely, of course, that this was the answer to the question of when Powell will stop calling the growing inflation a "temporary phenomenon", although everything may be... One way or another, we did not expect traders to react a certain way to the completely mundane speech of the Fed chairman. But we always warn traders that such events should not be overlooked and during their course, you should be especially careful and cautious. There was nothing particularly interesting in Great Britain yesterday. All that remains is to deal with the trading signals and deals on Tuesday. It should be noted right away that there was a distance of 20 points between the Kijun-sen critical line and the extreme level, so they could be worked out separately. The first buy signal was formed when the pair overcame the Kijun-sen. At this point, traders should have taken long positions. Then the pair overcame 1.3352 quite easily, but a little later it settled below it, so it was necessary to close longs in profit by several points and open shorts. However, the downward movement did not continue either, as the price bounced off the critical line, forming another buy signal. A couple more points of profit, close the shorts, open new longs. The pair, meanwhile, again failed to continue its upward movement, however, it passed a total of 20 points, therefore, in any case, the Stop Loss should have been set to breakeven. In this order, most likely, a long position was closed. The most interesting thing started after. The pound/dollar pair began to collapse, but at a slower rate, so one could have time to jump on this train to the downside if we acted promptly. When the price settled below the critical line, traders could open shorts. If this was done, then it was possible to earn about 75 points on them, since the pair overcame the levels 1.3277 and 1.3246 on its way and only "calmed down" around the latter.
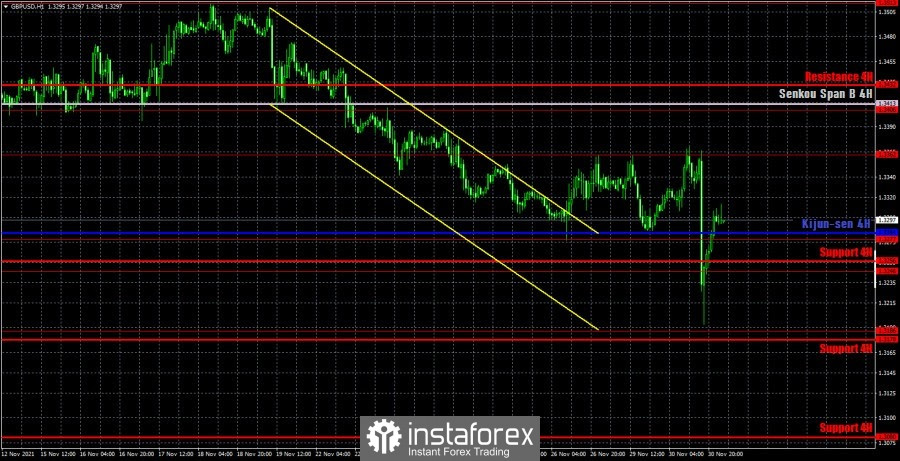
GBP/USD 1H

On the hourly timeframe, the pound/dollar pair broke out of the downward trend, but, as we expected, easily, quickly and simply resumed the downward trend. Even Powell's speech yesterday cannot be considered the main reason for this. On Monday, the pair was gravitating towards a new fall and by chance did not renew its annual lows. However, at the same time, such a powerful fall may be the beginning of the end for the dollar. It looks too unfounded now. Today it will be known for certain why it happened, after which it will be possible to draw conclusions. We distinguish the following important levels on December 1: 1.3186, 1.3246, 1.3277, 1.3362, 1.3406. Senkou Span B (1.3413) and Kijun-sen (1.3284) lines can also be signal sources. Signals can be "rebounds" and "breakthrough" of these levels and lines. It is recommended to set the Stop Loss level at breakeven when the price passes 20 points in the right direction. The Ichimoku indicator lines can move during the day, which should be taken into account when looking for trading signals. On Wednesday in the UK, the Bank of England Governor Andrew Bailey is scheduled to speak, who can, like his colleagues, touch on the topic of the new omicron strain. In addition, the US will publish a report on business activity in the manufacturing sector ISM.
We recommend you to familiarize yourself:
Overview of the EUR/USD pair. December 1. Christine Lagarde: The eurozone is ready for a new "wave" of the pandemic
Overview of the GBP/USD pair. December 1. France and the UK are in conflict over migrants. Powell warns of the risks associated with the Omicron
Forecast and trading signals for EUR/USD for December 1. Detailed analysis of the movement of the pair and trade deals.
COT report
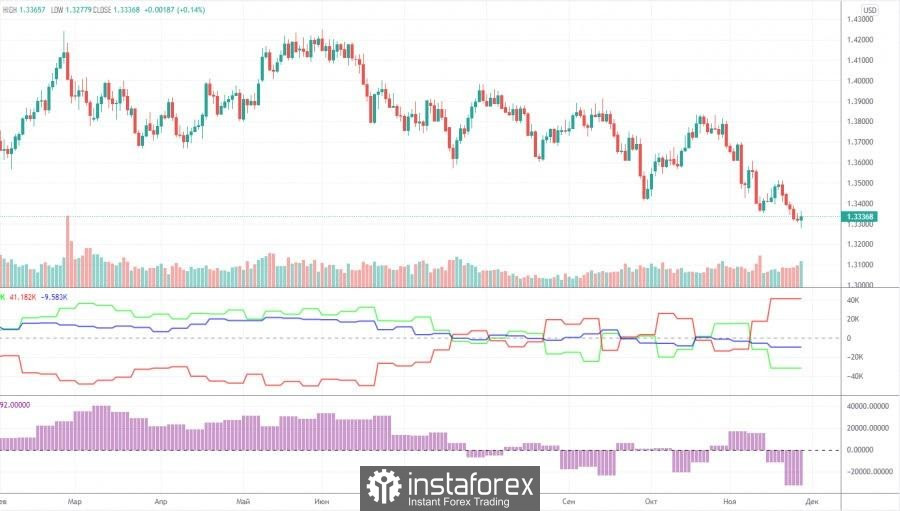
The mood of professional traders became much more bearish during the last reporting week (November 9-15). However, this should not be surprising, since the mood of major players has been constantly changing over the past few months, which is perfectly reflected in the first indicator in the chart above. The green and red lines, which indicate the net positions (in other words, the mood) of non-commercial and commercial traders, constantly change the direction of movement and constantly change their position relative to the zero level. The last reporting week only confirmed us in these conclusions. The green line has dropped significantly again, and the red line has increased significantly, although a couple of weeks ago it was the other way around. Thus, formally, the mood of professional traders has become more bearish, but in reality it changes every couple of weeks, so we can not make a long-term conclusion. The non-commercial group closed 4,000 buy contracts (longs) and opened 17,000 sell contracts (shorts) during the reporting week. Thus, the net position decreased by 21,000 contracts at once, which is a lot for the pound. However, this does not matter much, since the net position of non-commercial traders also constantly jumps up and down, which is eloquently signaled by the second indicator in the chart above. It should also be noted that in the long term, the pound/dollar exchange rate itself also constantly jumps up and down. Thus, it is not possible to make a long-term forecast based on COT reports.
Explanations for the chart:
Support and Resistance Levels are the levels that serve as targets when buying or selling the pair. You can place Take Profit near these levels.
Kijun-sen and Senkou Span B lines are lines of the Ichimoku indicator transferred to the hourly timeframe from the 4-hour one.
Support and resistance areas are areas from which the price has repeatedly rebounded off.
Yellow lines are trend lines, trend channels and any other technical patterns.
Indicator 1 on the COT charts is the size of the net position of each category of traders.
Indicator 2 on the COT charts is the size of the net position for the non-commercial group.