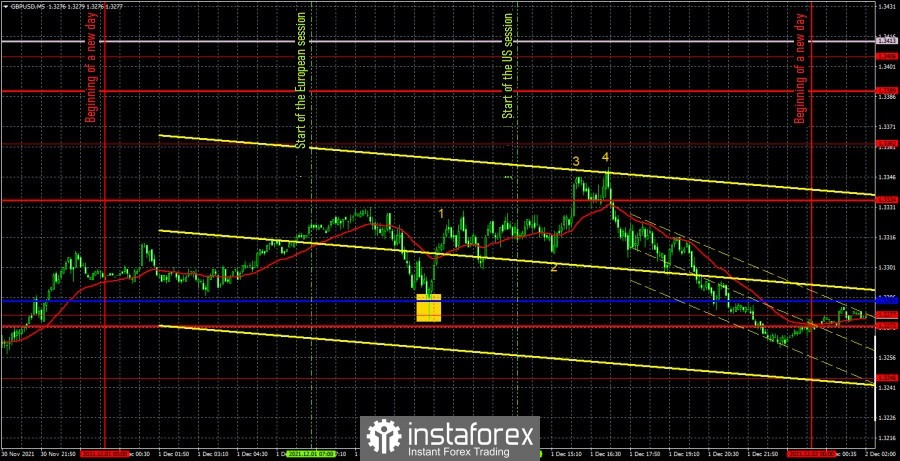
GBP/USD 5M

The GBP/USD currency pair traded in different directions, but still maintained a slight upward trend. The pair changed direction several times during the day and passed a total of 76 points. Thus, volatility is still not too high, and bulls are in no hurry to buy the pair ahead of the meetings of the Federal Reserve and the Bank of England. The last meetings in 2021, at which both central banks may decide to tighten monetary policy. Among the macroeconomic statistics, we highlight the report on business activity in the UK manufacturing sector for November, which decreased by only 0.1 points (figure "1" in the chart) and did not cause any market reaction. The speech of Bank of England Governor Andrew Bailey (the figure "3" in the chart) also did not provoke any special reaction. And we have already talked about US reports in the euro/dollar review. Both major pairs moved after the publication of the ADP and ISM reports in the wrong direction, which could be expected to move. We can only deal with the trading signals that formed during yesterday's day. It was the only one...
The price bounced off the Kijun-sen line and the extreme level of 1.3284 in the middle of the European trading session, showing what a strong and accurate signal is. The rebound was perfect. After that, the pair went up more than 50 points and overcame the resistance level of 1.3334. Recall that trading signals are not formed near the support and resistance levels, but they can be used to close already open transactions. That's exactly how it should have been done yesterday. When the pair fell below the level of 1.3334, it was necessary to close deals to buy. The profit on them amounted to 35-37 points. Quite well.
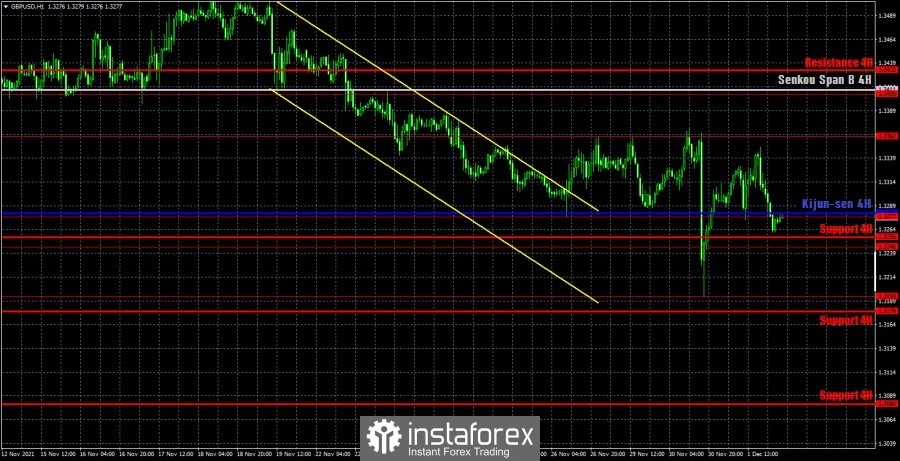
GBP/USD 1H

On the hourly timeframe, the pound/dollar pair broke out of the descending channel, but it did not succeed in developing an upward movement. The price cannot overcome the extreme level of 1.3362 in any way, from which it has already made four rebounds. Thus, the further growth of the British pound is a big question. However, the price cannot go below the critical line either, except for a strong and random movement on Tuesday after statements about inflation from Fed Chairman Jerome Powell. Thus, we can even say that at this time the pound/dollar pair is inside the horizontal channel between the levels of 1.3281 and 1.3362. We highlight the following important levels on December 2: 1,3193, 1,3246, 1,3277, 1,3362, 1,3406. The Senkou Span B(1.3411) and Kijun-sen(1.3281) lines can also be signal sources. Signals can be "rebounds" and "breakthroughs" of these levels and lines. It is recommended to set the Stop Loss level to breakeven when the price passes in the right direction by 20 points. The lines of the Ichimoku indicator can move during the day, which should be taken into account when searching for trading signals. No interesting events are planned either in the UK or in the US on Thursday. There will be absolutely nothing to pay attention to. Therefore, it is unlikely that active trading and trend movement are waiting for us today. Especially considering the high probability of a flat on the hourly timeframe.
We recommend you to familiarize yourself:
Overview of the EUR/USD pair. December 2. Jerome Powell amused the markets with his inflation statements for several months. But in the end he told the truth
Overview of the GBP/USD pair. December 2. The Omicron strain can stop the rise in inflation around the world
Forecast and trading signals for EUR/USD for December 2. Detailed analysis of the movement of the pair and trade deals.
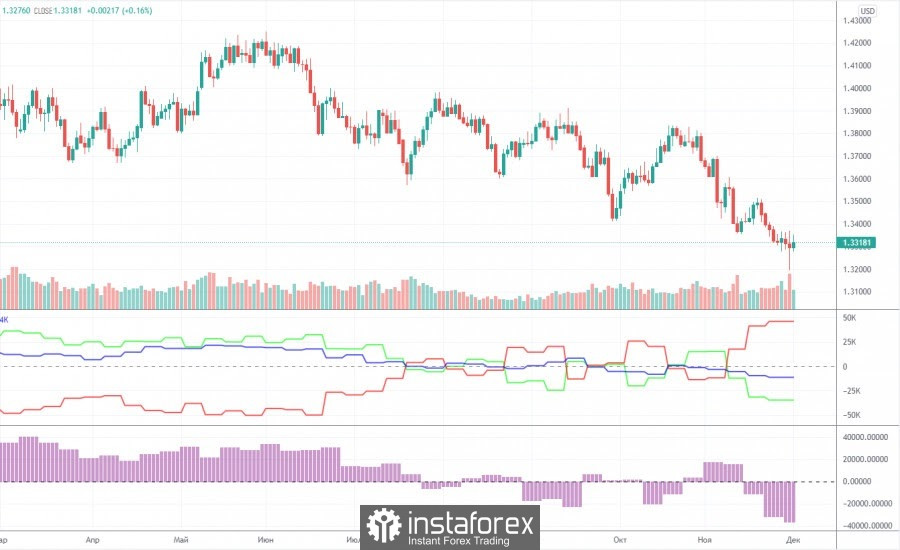
COT report

The mood of professional traders practically did not change during the last reporting week (November 16-22). During the entire week, a little more than a thousand buy contracts (longs) were closed and about 3,000 sell contracts (shorts) were opened by a group of "non-commercial" traders. Thus, their net position decreased by 4,000 contracts, which is not much even for the pound. The overall picture of the situation does not change at all. The first indicator in the chart above continues to display all the changes in the mood of non-commercial (green line) and commercial (red line) traders. As you can see, the mood is constantly changing and it started around the month of July. Since then, the players can't decide what to do with the pound at all? Despite the fact that the British currency has been declining all this time, we still cannot make a long-term forecast, as the mood of professional traders is constantly changing. For example, at this time, the green and red lines are quite significantly distanced from each other. About the same as in March or June, when a long uptrend ended. However, then the long upward trend ended, and now we are talking about a downward correction. Of course, it may also be nearing its completion, but doubts about the indications of the Commitment of Traders (COT) reports still remain. However, at the same time, it cannot be said that the mood of professional traders is definitely bearish now, since they have almost twice as many sell contracts open as buy contracts. But the very nature of the pair's movement in 2021 does not allow us to assume that after the pound falls by 600 points, this process will continue without an upward pullback.
Explanations for the chart:
Support and Resistance Levels are the levels that serve as targets when buying or selling the pair. You can place Take Profit near these levels.
Kijun-sen and Senkou Span B lines are lines of the Ichimoku indicator transferred to the hourly timeframe from the 4-hour one.
Support and resistance areas are areas from which the price has repeatedly rebounded off.
Yellow lines are trend lines, trend channels and any other technical patterns.
Indicator 1 on the COT charts is the size of the net position of each category of traders.
Indicator 2 on the COT charts is the size of the net position for the non-commercial group.