empty
 
 
13.06.2022 10:08 AM
USD/JPY analysis and outlook for June 13, 2022

Higher and higher...

Hi, dear traders!

USD/JPY bears have failed to stop the pair from skyrocketing, despite their best efforts. Last week, the quote reached the highest level since 2002, resulting in speculation about possible currency stabilization measures by the Bank of Japan. In the meantime, price growth in the US shows no sign of stopping, forcing the Fed to continue its monetary tightening policy. Further Fed funds rate hikes are very likely to boost the US dollar, particularly against the Japanese yen. Much will depend on how much are the Fed's next steps already priced in by the market. The reaction of market players is also key.

Weekly

This image is no longer relevant

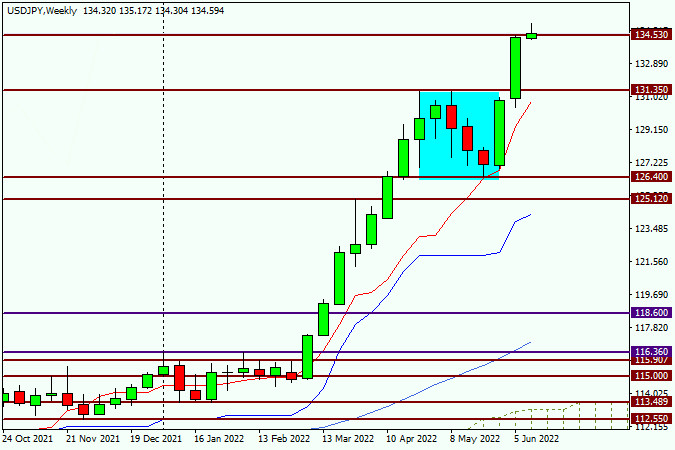
According to the weekly chart and the overall market sentiment, the uptrend of USD/JPY shows no signs of slowing down. Further upside risks can now be clearly seen. The pair performed a downward correction from 131.32. While this move could have been a trend reversal, each of the 3 bearish candlesticks had sizeable lower shadows. However, the pair bounced off the strong support at 126.41 later and continued to climb. USD/JPY broke above the key psychological and technical level of 130.00 two weeks ago, closing at 130.78. Last week, the pair retraced to 130.40 and surged upwards afterwards, finishing the week at 134.36. If USD/JPY continues to move upwards, it will test the psychological level of 135.00 and the historical level of 135.20. The main trading strategy at this moment is opening long positions, but going long on USD/JPY is currently not advantageous. However, it is unclear if the pair would have a downward correction that would allow traders to open long positions.

Daily

This image is no longer relevant

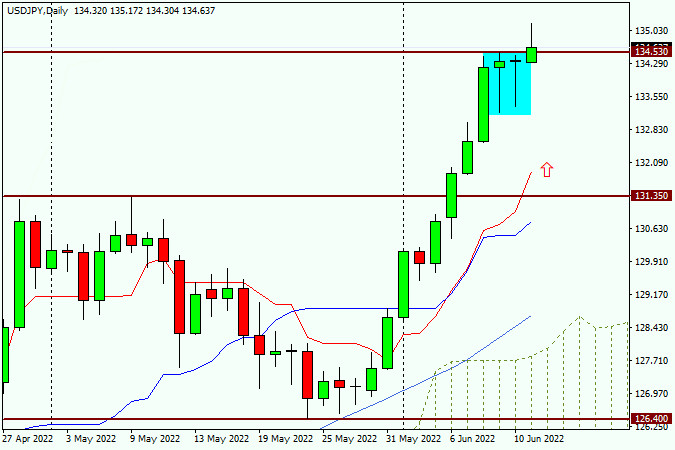
Bearish reversal patterns can now be clearly seen on the daily chart, as indicated by the highlighted hanging man pattern. However, judging by the upside momentum of USD/JPY, these patterns would be more important if they had appeared on the weekly chart. However, two consecutive Gravestone Doji patterns should also be noted. The pair has not yet retraced down to the broken resistance level of 131.32 at this timeframe. If the market ignores these signals, the pair could break above 135.00 and 135.20. In this scenario, opening long positions can be considered if USD/JPY settles above these levels and retraces back into the 135.20-135.00 area afterwards. New long positions at more attractive prices would only be possible if the pair moves downwards into the 132.00-131.40 area, or the key technical level of 134.00. In this situation, traders should look for buy signals in the 134.15-134.00 on the daily chart or lower timeframes.

Good luck!

Jana pendapatan melalui perubahan kadar mata wang kripto dengan InstaForex.
Muat turun MetaTrader 4 dan buka dagangan pertama anda.
  • Grand Choice
    Contest by
    InstaForex
    InstaForex always strives to help you
    fulfill your biggest dreams.
    SERTAI PERADUAN
  • Chancy Deposit
    Deposit akaun anda sebanyak $3,000 dan dapatkan $9000 lebih lagi!
    Dalam Mei kami membuat cabutan bertuah $9000 dalam Kempen Chancy Deposit!
    Dapatkan peluang untuk menang dengan membuat deposit $ 3000 ke dalam akaun dagangan. Setelah memenuhi syarat ini, anda menjadi peserta kempen.
    SERTAI PERADUAN
  • Trade Wise, Win Device
    Daftar untuk peraduan dan tambah dana akaun anda dengan sekurang-kurangnya AS$ 500 untuk layak memenangi peranti mudah alih.
    SERTAI PERADUAN
  • Bonus 100%
    Peluang istimewa anda untuk menerima bonus 100% pada deposit anda
    DAPATKAN BONUS
  • Bonus 55%
    Dapatkan bonus 55% pada setiap deposit anda
    DAPATKAN BONUS
  • Bonus 30%
    Dapatkan bonus 30% setiap kali anda membuat penambahan dana akaun anda
    DAPATKAN BONUS

Artikel yang dicadangkan

Tidak boleh bertanya sekarang?
Tanya soalan anda di Ruangan bersembang.
Panggilan semula Widget