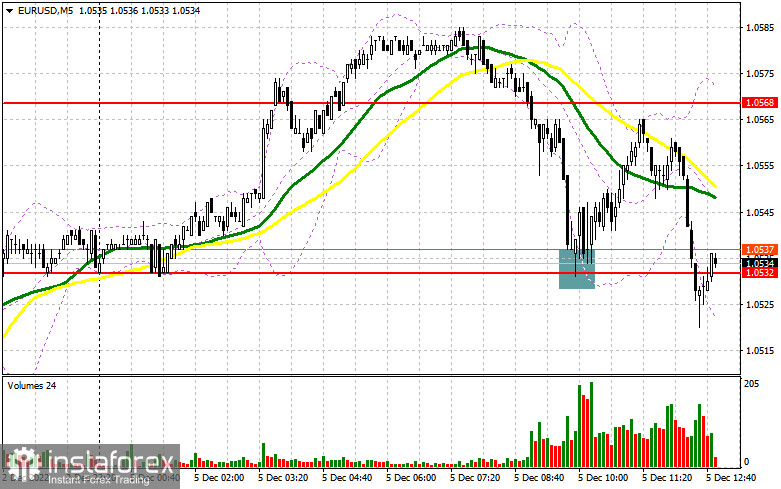
In my previous analytical review, I drew your attention to the level of 1.0537 and recommended entering the market from it. Let's have a look at the 5-minute chart and analyze the situation there. As the pair fell due to the weak PMI data, bulls managed to defend the support of 1.0532. A false breakout at this level gave a buy signal to continue the bull market. The price soared by about 30 pips, after which the pressure on the pair returned. In the second half of the day, the technical picture changed.
Long positions on EUR/USD:
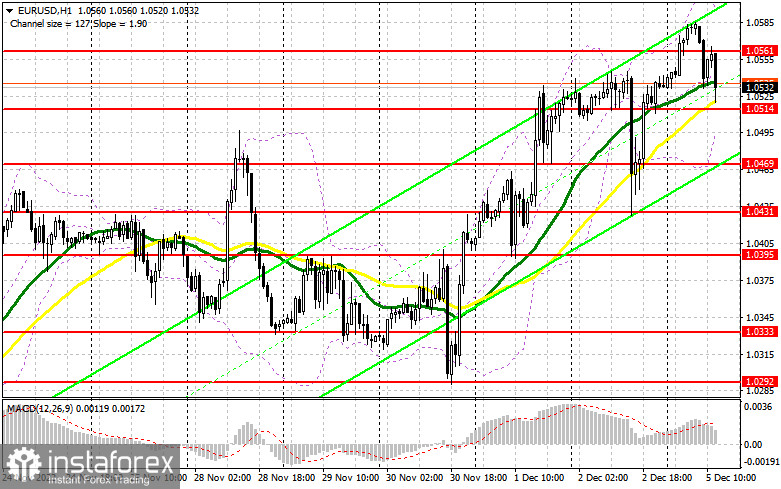
In the eurozone, the Services PMI and the PMI Composite showed weak performance. The indices caused the euro to fall in the first half of the day, forcing speculative traders to take profits after the morning rally. In the second half of the day, the market will scrutinize similar reports on the US economy. The forecasts promise weak results too. If the PMI Composite and ISM Services indices in the US decline, it may drag the European currency up during the North American session against the US dollar, as they will remind traders that the US economy is gradually sliding into a recession. Notably, the looming recession is unlikely to be avoided next year. Changes in the Factory Orders index will not have much of an impact on the pair's direction. If the figures exceed economists' expectations in some indicators, the pressure on the pair may be stronger. In this case, it would be better to buy the euro on a false breakout near the new support of 1.0514, which was formed last Friday. That will give a buy signal for the EUR/USD pair and open the way to 1.0561 that was formed today. A breakthrough and a top-down test of this level may support bulls and lead the price to 1.0604. If this range is broken through on the background of the weak fundamental data in the US, the price may move to a new monthly high of 1.0640, where traders may lock in profits. If the EUR/USD pair declines during the North American session, bulls show weak activity at 1.0514, traders may continue to take profits. This is likely to put pressure on the euro. In this case, it is better to buy the euro only after a false breakout near the support of 1.0469. One may open long positions on a rebound only from 1.0431 or lower near the low of 1.0395, allowing an upward intraday correction of 30-35 pips.
Short positions on EUR/USD:
Despite the fall of the euro, nothing critical has happened so far. The fundamental US data may reverse the market and reinforce the European currency. For this reason, it would be wise to seriously consider selling the euro. In the second half of the day, a false breakout at 1.0561 would be optimal to open short positions. The price may test this level during the publication of fundamental statistics. This is likely to create an entry point and brings the euro down to the support of 1.0514, just above which the moving averages are located. At the moment, the MAs support bulls. If the price settles below 1.0514 and makes a downward test of this level, this may give an additional signal and trigger buyers' Stop-Loss orders. Following this scenario, the euro may drop to 1.0469, where traders may consider taking profits. The next target is located at 1.0431. However, this target may be reached if the US PMI Services comes back above 50 points. If the EUR/USD pair increases during the North American session and bears show no activity at 1.0561, speculative sellers may start to flee the market. This is likely to support bulls, return the uptrend, and open the way to 1.0604. It would be better to sell the euro from this level only on a false breakout. In addition, short positions on the euro can be opened from the high of 1.0640, allowing a downward correction of 30-35 pips.
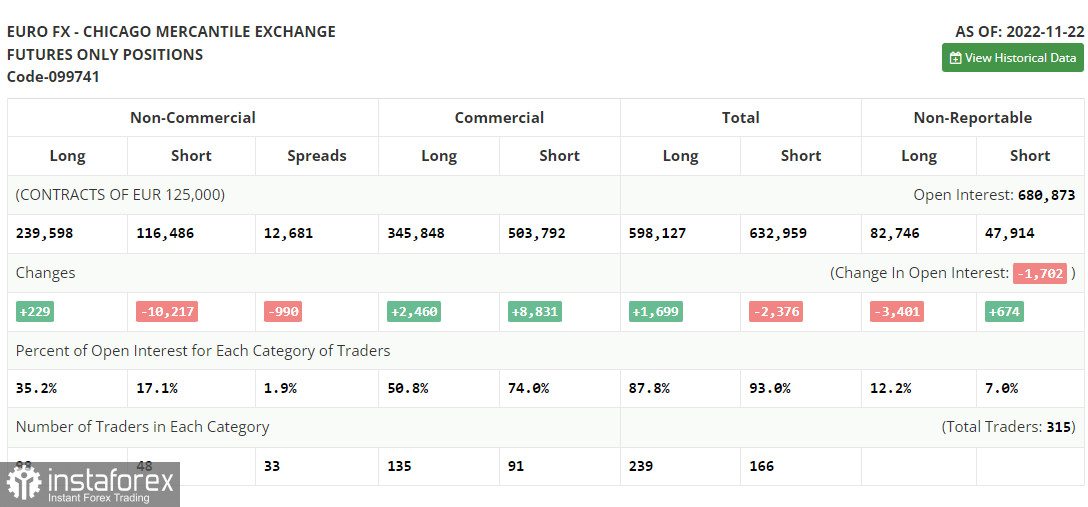
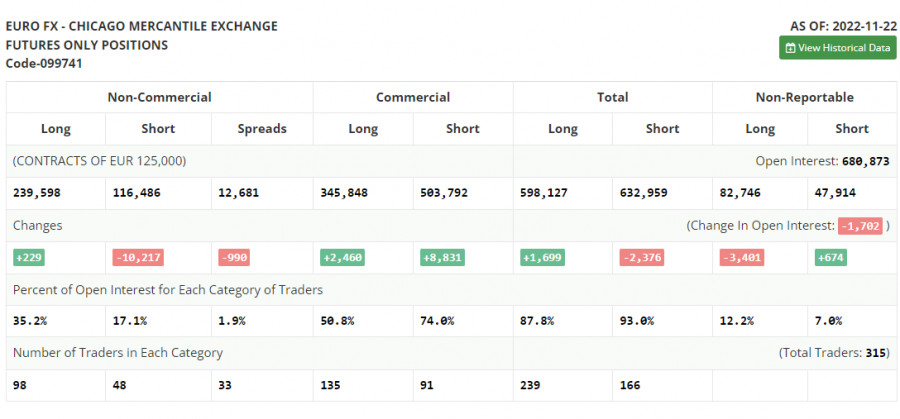
The COT report for November 22 logged an increase in long positions and a sharp decline in short ones. The Fed officials made statements that allowed euro buyers to open more positions in the market. Traders once again believed that the FOMC may change aggressive policy on rate hikes in the US. Some quite important statistics on GDP and the US labor market are coming soon, which may become a game-changer. The market is also waiting for the important inflation data for November. The cutting of new jobs and rising unemployment would lead to a sharp weakening of the US dollar against risky assets, including the euro. Markets will also pay close attention to the statements made by the Chairman of the Fed. If they continue to be hawkish, another reason to buy the US dollar. This is derived from the fact that further interest rate hikes may push the economy into a bigger recession. The COT report indicated that long non-commercial positions rose by 229 to 239,598, while short non-commercial positions fell sharply by 10,217 to 116,486. At the end of the week, the total non-profit net positioning was up 123,112 versus 112,666. This indicates that investors continue to seize the moment and continue to buy the cheap euro even above parity, as well as accumulate long positions, counting on the end of the crisis and the pair's recovery in the longer term. The weekly closing price fell to 1.0315 against 1.0390.
Indicator signals:
Moving averages
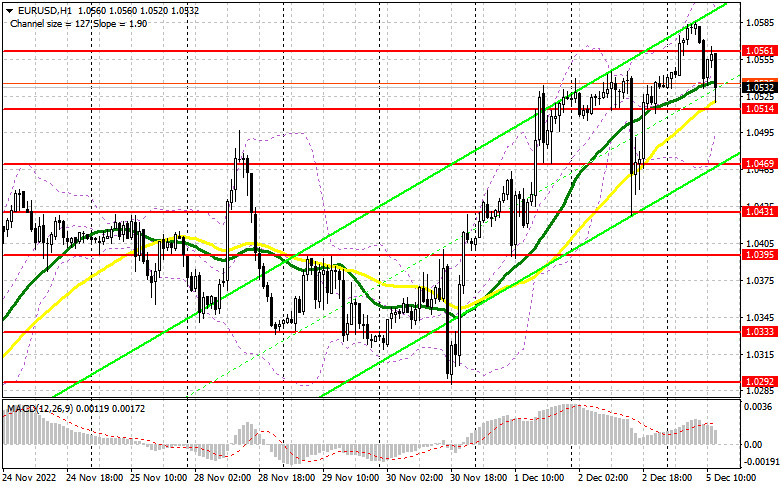
Trading above the 30- and 50-day moving averages indicates that bulls are controlling the market.
Note: Period and prices of moving averages are considered by the author on hourly chart H1 and differ from the common definition of classic daily moving averages on daily chart D1.
Bollinger Bands
If the pair declines, the lower band of the indicator near 1.0514 will offer support.
Indicators description
- Moving average defines the current trend by smoothing out volatility and noise. Period 50. Marked in yellow on the chart.
- Moving average defines the current trend by smoothing out volatility and noise. Period 30. Marked in green on the chart.
- MACD (Moving Average Convergence/Divergence) indicator. Fast EMA 12. Slow EMA 26. SMA 9.
- Bollinger Bands. Period 20.
- Non-commercial traders are speculators, such as individual traders, hedge funds, and large institutions, which use the futures market for speculative purposes and meet certain requirements.
- Long non-commercial positions represent the total long open position of non-commercial traders.
- Short non-commercial positions represent the total short open position of noncommercial traders.
- The total non-commercial net position is the difference between short and long positions of non-commercial traders.