Analyzing Friday's trades:
EUR/USD on 30M chart
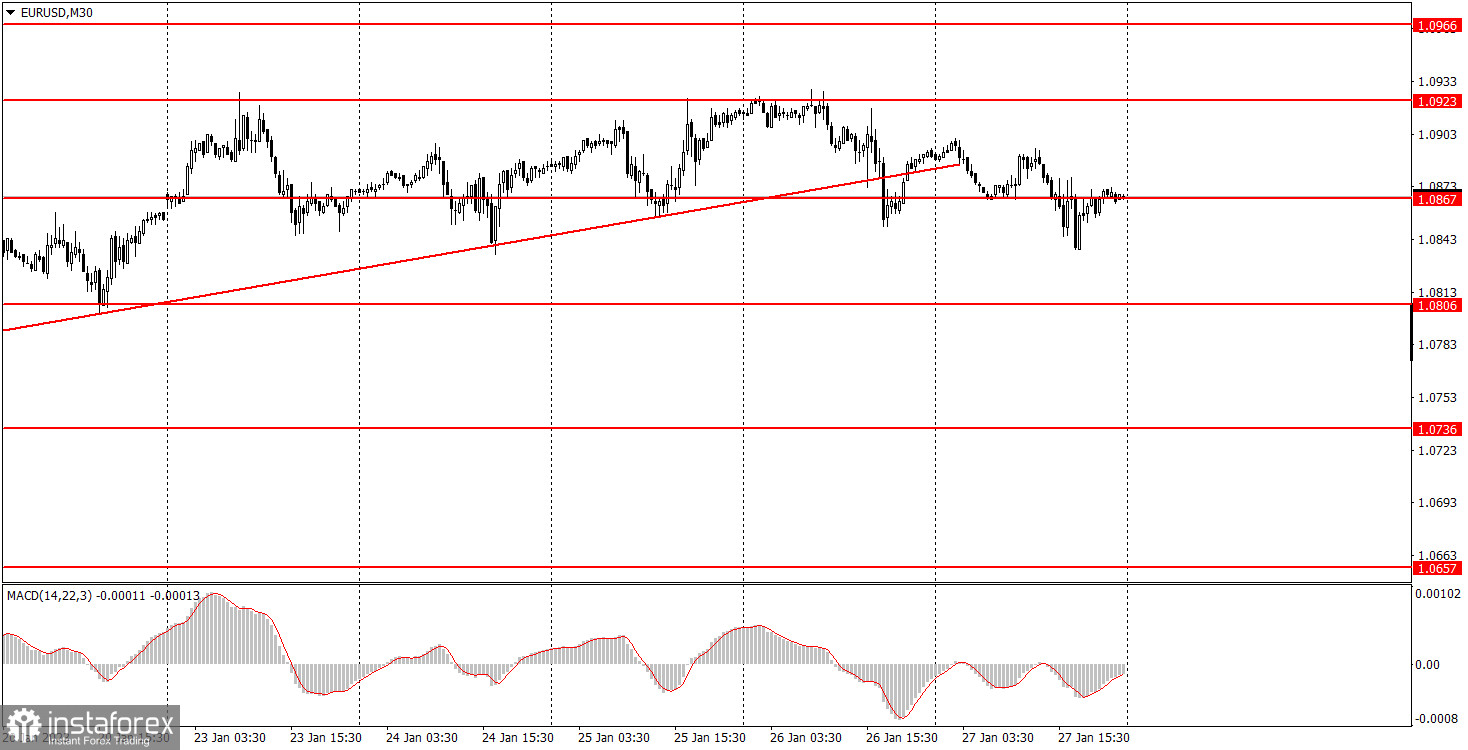
EUR/USD started a downward movement on Friday after settling below the trend line on Thursday. In fact, the pair has been moving sideways for two weeks now instead of moving up or down. It doesn't make any sense to speak about the downward movement either because the pair just kept on edging up the whole time. At the same time, a paradoxical situation surfaced when the pair has no fundamental and macroeconomic reasons for growth, but the market cannot push the price up and simply does not want to go down. We are seeing illogical and chaotic movements, which is why we should just wait for the upcoming week since several important reports will be published and three central bank meetings will be held by then. The market seems to be waiting for these events as well, but how will they react? So far, we don't know yet. Secondary reports on the US were published on Friday, but traders did not particularly pay attention to them.
EUR/USD on M5 chart
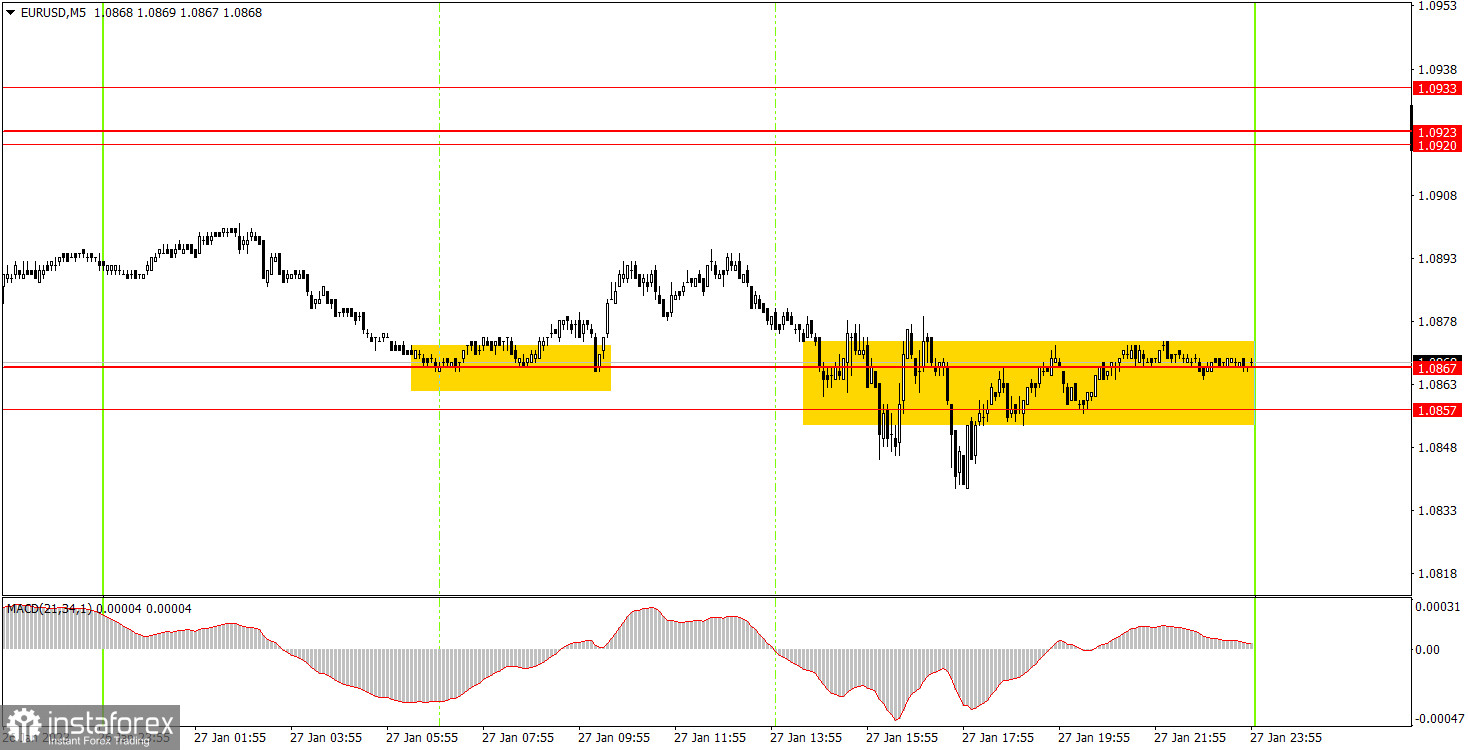
You can clearly see how the pair moved on the 5-minute chart. There was more or less an acceptable buy signal at the European session. The price went up after the rebound from 1.0867 by 16 pips, which was enough for the Stop Loss to breakeven. The long position was closed using this. Afterwards, it was followed by "dancing and singing" in the 1.0857-1.0867 area during the US session. And it was clear that the problem is not in the levels, but in the nature of the movement. When we see a solid "fence", it's difficult to count on strong and profitable signals. As a result, beginners could try to work on any signal near this area and surely made a small loss on it. The whole week was far from ideal, but at least there were no serious losses, and sometimes even good profits were made.
Trading tips on Monday:
The pair is trying to fall on the 30-minute chart, since EUR crossed the ascending trend line. The price also managed to settle below 1.0867, but so far the whole movement of the last weeks can be described as flat. Therefore, crossing the trend line is not very important. On the 5-minute chart, it is recommended to trade at the levels 1.0657-1.0668, 1.0697, 1.0736, 1.0768, 1.0806, 1.0857-1.0867, 1.0920-1.0923-1.0933, 1.0966, 1.0989. As soon as the price passes 15 pips in the right direction, you should set a Stop Loss to breakeven. There are no important events or reports planned for Monday in the EU and US, but several will be released during the week. So Monday might be a calm day, but then the volatility could be very high.
Basic rules of the trading system:
1) The strength of the signal is determined by the time it took the signal to form (a rebound or a breakout of the level). The quicker it is formed, the stronger the signal is.
2) If two or more positions were opened near a certain level based on a false signal (which did not trigger a Take Profit or test the nearest target level), then all subsequent signals at this level should be ignored.
3) When trading flat, a pair can form multiple false signals or not form them at all. In any case, it is better to stop trading at the first sign of a flat movement.
4) Trades should be opened in the period between the start of the European session and the middle of the US trading hours when all positions must be closed manually.
5) You can trade using signals from the MACD indicator on the 30-minute time frame only amid strong volatility and a clear trend that should be confirmed by a trendline or a trend channel.
6) If two levels are located too close to each other (from 5 to 15 pips), they should be considered support and resistance levels.
On the chart:
Support and Resistance levels are the levels that serve as targets when buying or selling the pair. You can place Take Profit near these levels.
Red lines are channels or trend lines that display the current trend and show in which direction it is better to trade now.
The MACD indicator (14, 22, and 3) consists of a histogram and a signal line. When they cross, this is a signal to enter the market. It is recommended to use this indicator in combination with trend patterns (channels and trendlines).
Important announcements and economic reports that can be found on the economic calendar can seriously influence the trajectory of a currency pair. Therefore, at the time of their release, we recommend trading as carefully as possible or exiting the market in order to avoid sharp price fluctuations.
Beginners on Forex should remember that not every single trade has to be profitable. The development of a clear strategy and money management is the key to success in trading over a long period of time.