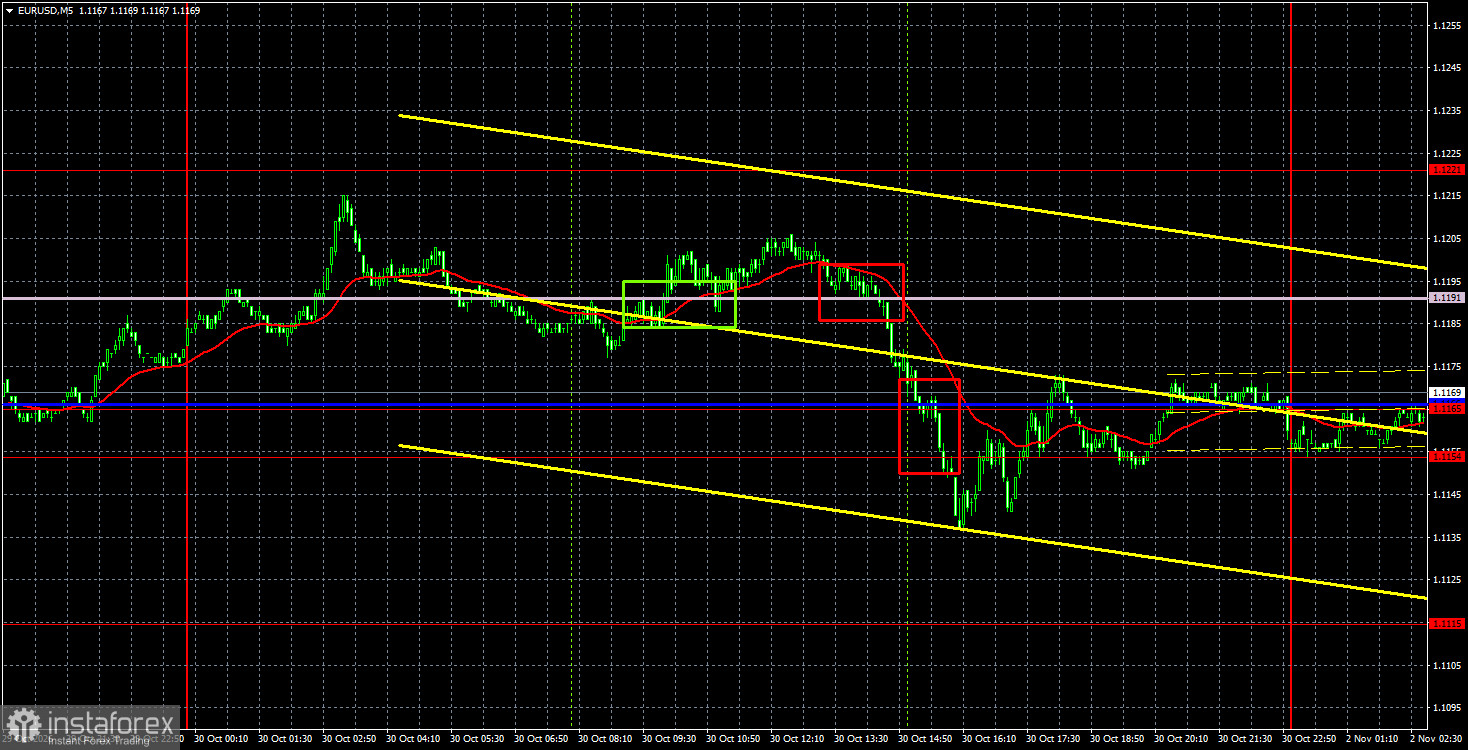
Analysis EUR/USD 5M
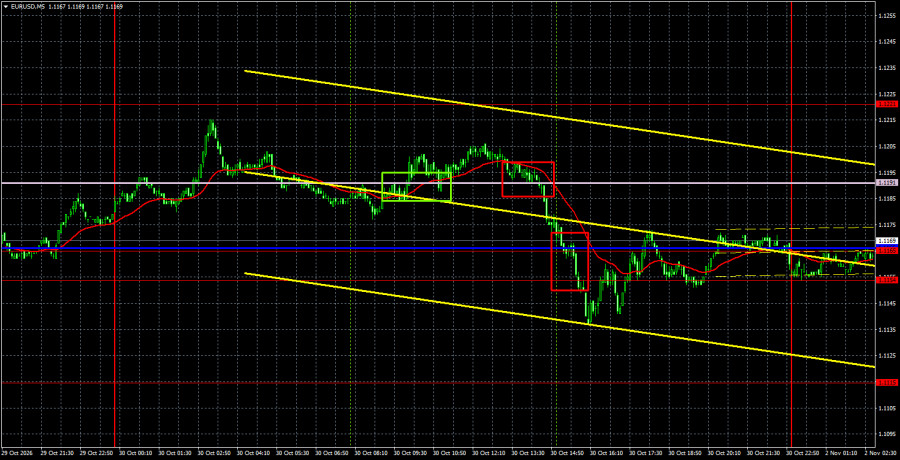
The EUR/USD pair began a new leg down on Friday, effectively triggered by one event — Germany's inflation report. At least four key releases came out that day: two supported the euro, and two argued against it. Guess which report the market acted on? Naturally, the one that supported the dollar. Germany's annual CPI fell from 3.3% to 2.8% in October, and that was enough for the market to ignore stronger GDP prints for both Germany and the euro area. Traders concluded that if inflation in the euro zone's largest economy is slowing, the European Central Bank might abandon plans for further tightening or adopt a more dovish tone. In reality, however, this single report does not determine policy. First, Germany is only one EU member, while overall euro-area inflation continues to rise. Second, the ECB is still aiming for at least one more hike in December. We would interpret a move toward a dovish ECB only if inflation across the entire euro area slowed substantially — and even then only if the Middle East conflict had moved decisively toward resolution. Oil is already trading comfortably above $110/bbl; if the conflict resumes after the U.S. elections, it could rise toward $150 this winter, and then there will be no question of disinflation.
Technically, the downtrend might be exhausted since the trend line was broken. If price convincingly clears the Senkou Span B line, that would significantly improve bulls' prospects for the euro. But for now the market again shows little appetite for buying.
On the 5-minute timeframe, several trade signals formed on Friday, but all proved false. Germany's inflation report spoiled the bulls' mood — they had been positioned for an intra-range rally.
COT report
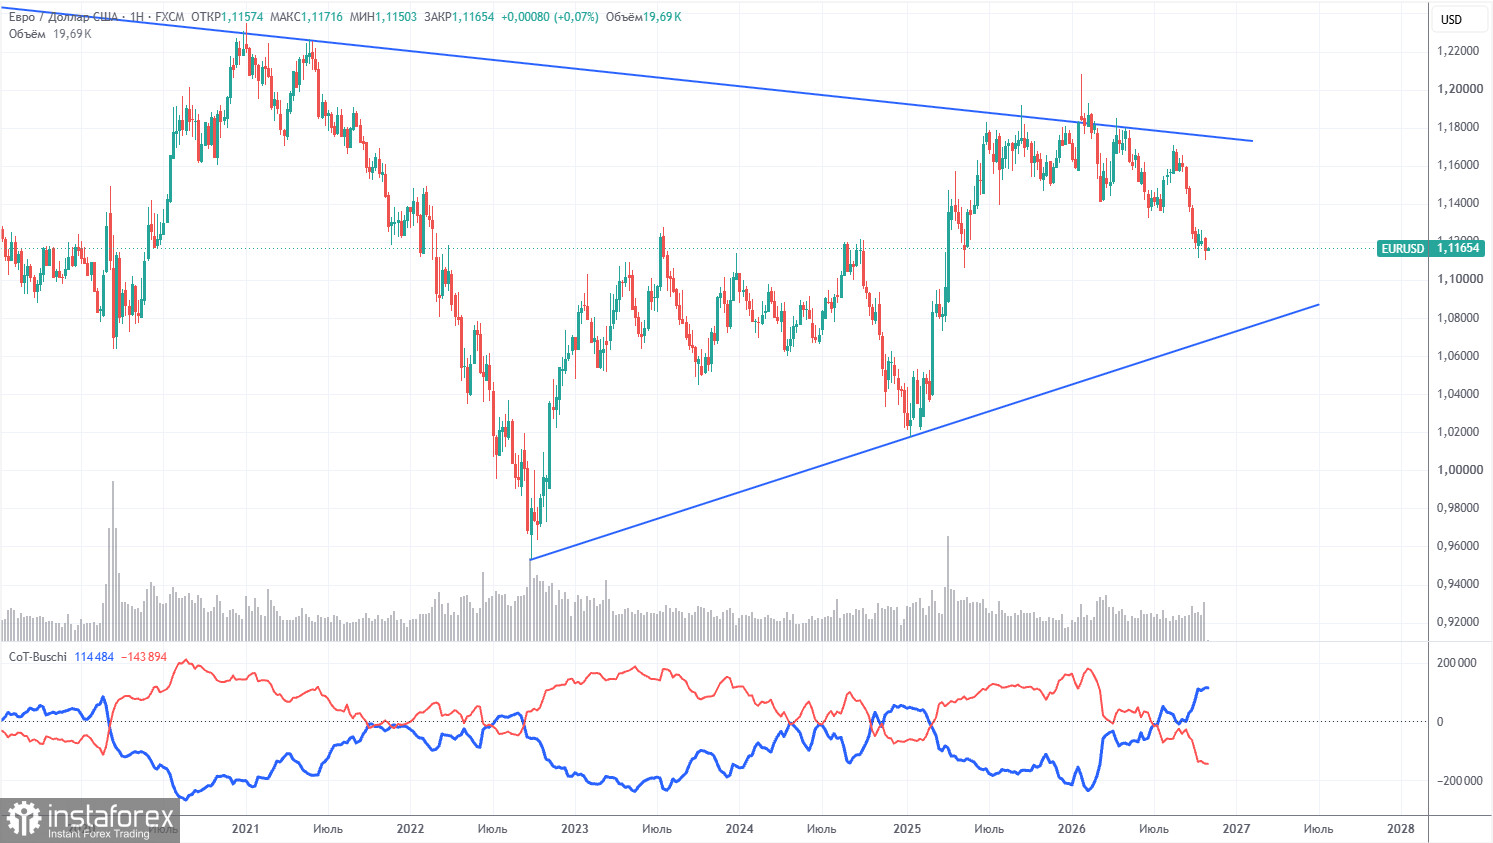
The latest COT report is dated October 27. On the weekly timeframe, the net position of non-commercial traders remains bearish and has fallen substantially in 2026 amid geopolitical events. Over the past eight months, traders have been exiting the euro in favor of the U.S. dollar. Donald Trump's policies have not changed, and the dollar has at times served as a reserve currency.
However, we still do not see fundamental reasons for sustained U.S. dollar strength. The Middle East war made the dollar temporarily highly attractive, and the Federal Reserve's policy stance surprised markets for the second time this year. Over the long term, the euro could fall to around $1.08 (the trend line), but the longer-term uptrend remains intact. Recently the market has priced in only dollar-positive factors and ignored everything else.
The arrangement of the red and blue indicator lines points to a bears' advantage. During the last reporting week, long positions among the "Non-commercial" group rose by 4,200, while shorts increased by 13,600. Accordingly, the net position fell by another 9,400 contracts over the week.
Analysis EUR/USD 1H
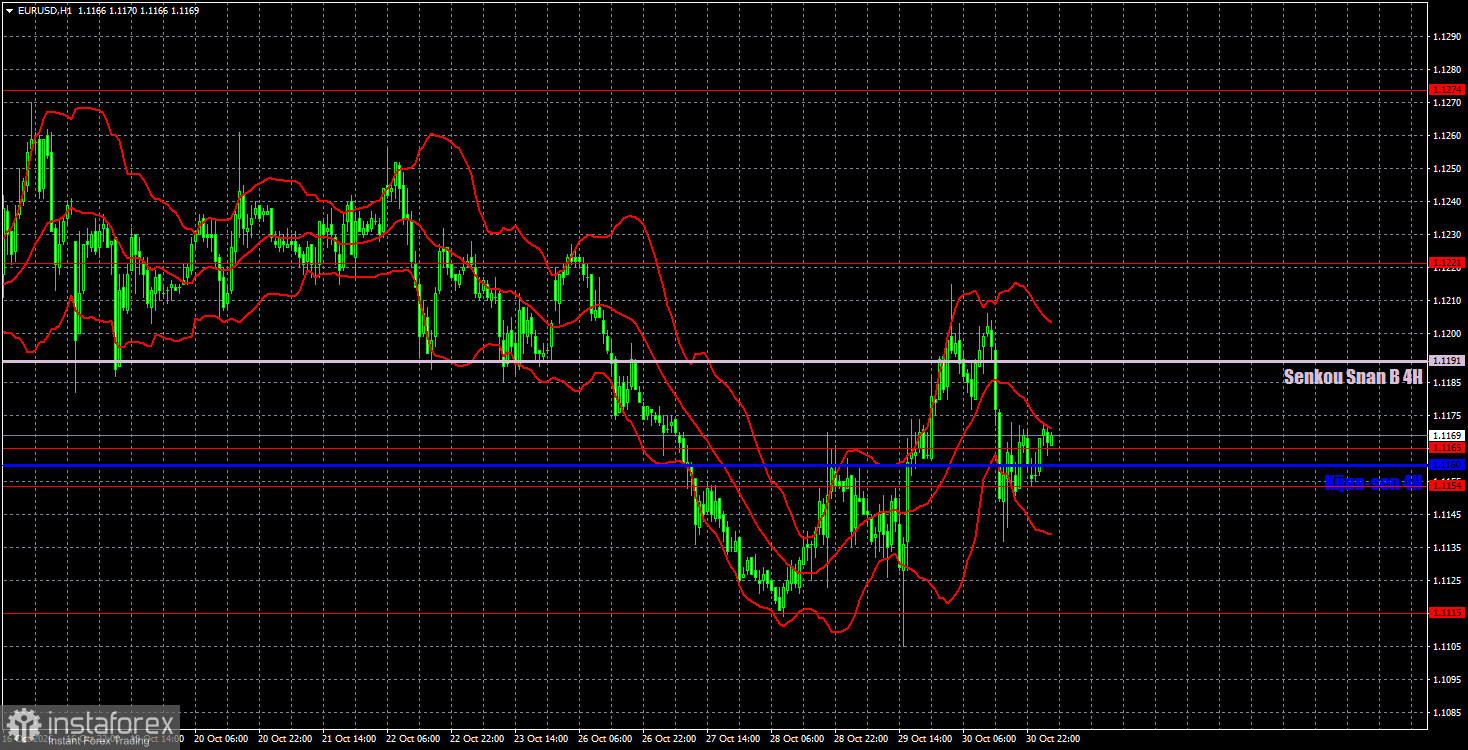
On the hourly timeframe, EUR/USD could form an uptrend but is currently stuck in a sideways channel. Looking at the daily and weekly charts, the chances of a strong, lasting trend remain high. However, for the euro to rise, it needs to be bought — and over the past two months we have not seen much market appetite for euros. Based on current sentiment, we would say the prospect of sustained euro strength still looks doubtful.
For November 2 we highlight the following trading levels — 1.1006, 1.1115, 1.1154–1.1165, 1.1221, 1.1274, 1.1362–1.1368, 1.1461–1.1473, 1.1536–1.1542, 1.1585, 1.1657–1.1665, and the Ichimoku Senkou Span B (1.1191) and Kijun-sen (1.1160) lines. Ichimoku lines may shift during the day, so factor that in when judging signals. Remember to move your Stop Loss to breakeven after the price moves 15 pips in the correct direction to protect against losses if a signal proves false.
On Monday, the only important release is the U.S. ISM manufacturing index; other publications are secondary. Several major events later in the week may produce strong volatility and sharp reversals.
Summary of the above analysis:
Traders can consider short positions near 1.1115 if price holds below the 1.1154–1.1165 area. If price holds above the Senkou Span B line, consider longs at 1.1221 and 1.1274.
Notes on the charts:
- Support/resistance price levels (thick red lines) are areas where a move may stop; they are not direct signal sources.
- Kijun-sen and Senkou Span B — Ichimoku lines projected from the 4-hour timeframe onto the hourly chart — are strong levels.
- Extremum levels (thin red lines) are prior bounce points and do serve as signal sources.
- Yellow lines denote trendlines, trend channels, and other technical patterns.
- Indicator 1 on the charts (COT) shows the net position size for each trader category.