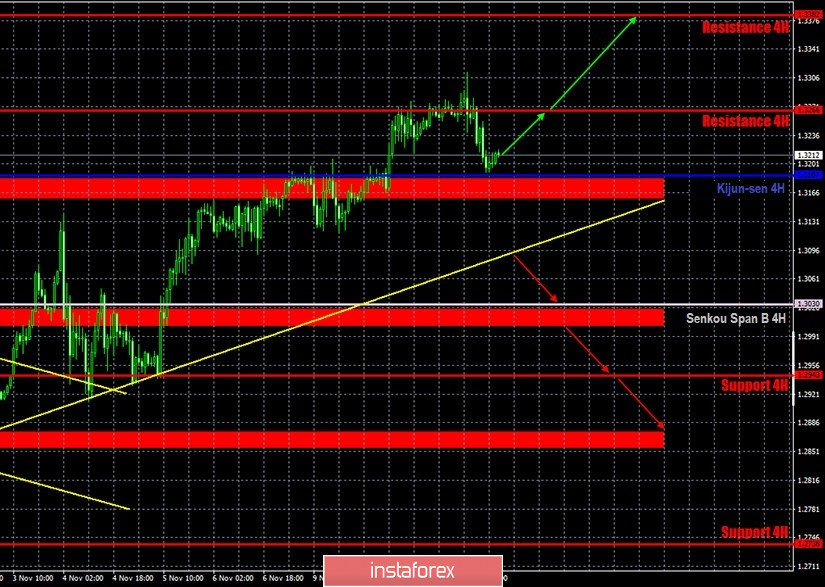
GBP/USD 1H

The GBP/USD pair tried to overcome the resistance level of 1.3266 on Wednesday, November 11, but it eventually failed to do so. Thus, a correction began with the nearest target, the Kijun-sen line, which was successfully worked out by the end of the trading day. And so the upward trend persists, since the price is above the critical line and the trend line. Bears are still rather weak, while bulls continue to dominate the market. The downward correction may even reach the trendline target if the price manages to overcome the Kijun-sen line. And even in this case, the upward trend will remain present. However, take note that the outlook for the pound remains extremely dim. It is even difficult to say what exactly pushed the pound to rise over the past few days, given that, for example, the euro/dollar pair was mainly falling. Yes, the fact that the House of Lords of the British Parliament rejected the Johnson Bill could have provided support to the pound. However, this is rather normal news for the pound, and not a reason to be happy. On the contrary, the pound should have declined on fears of the adoption of this scandalous bill. In general, there are still a lot of questions about strengthening the pound.
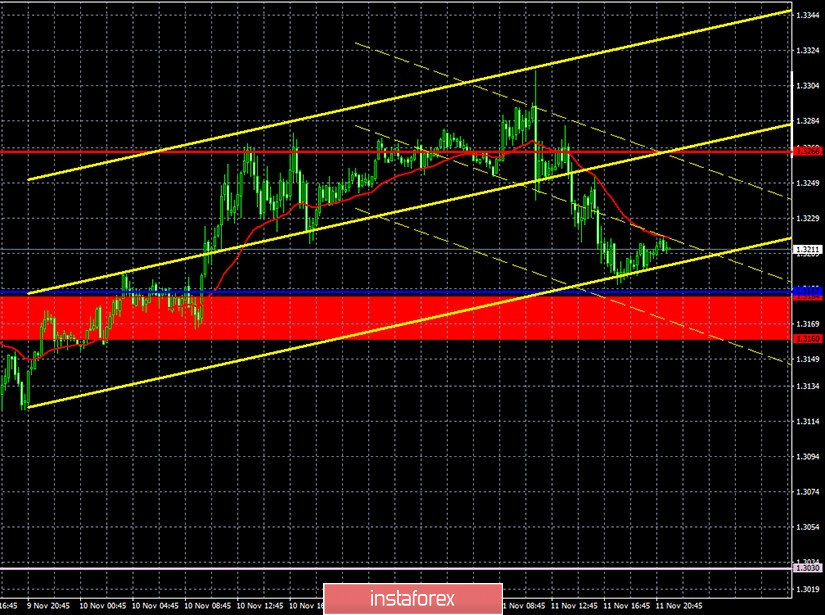
GBP/USD 15M
The lower linear regression channel turned to the downside on the 15-minute timeframe, indicating that a downward correction has started. However, the pair has not overcome the Kijun-sen line and the support area of 1.3160-1.3184. Therefore, further decline is still in question.
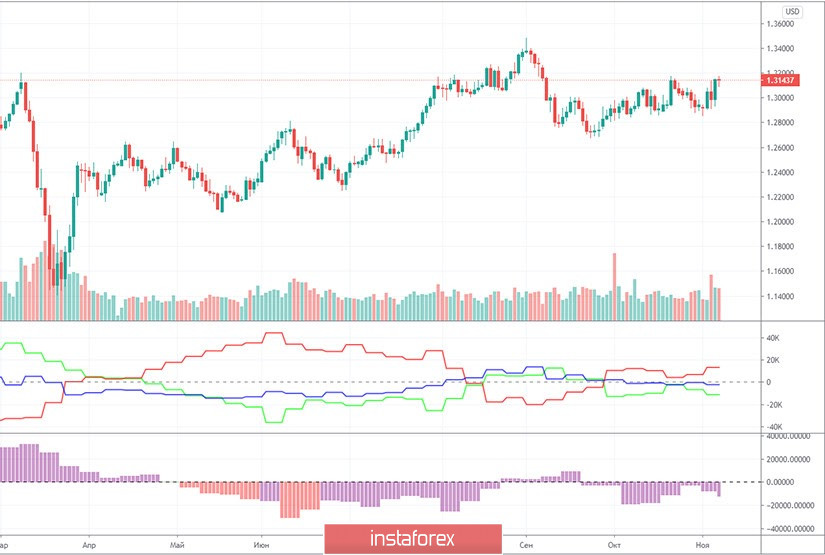
COT report
The GBP/USD pair only lost 100 points during the last reporting week (October 27-November 2). The pound began to rise after November 2. And it wasn't so much of a rise, but more like the dollar's fall. However, let's go back to the reporting period. Non-commercial traders closed 3,281 Buy-contracts (longs) and opened 1,146 Sell-contracts (shorts). Thus, the net position for the "non-commercial" group of traders decreased by 4,500. This is much more clearly visible on the chart of the first indicator. The green and red lines, which represent the net positions of the two most important groups of traders, began to diverge in different directions. Therefore, the mood of professional traders is becoming more bearish again. However, this change did not result in the pound's decline. Because elections were already held in the United States on November 3 and the dollar was only getting cheaper then. Therefore, the new Commitment of Traders (COT) report may show that the bearish mood is weakening among professional traders. However, in any case, we believe that the markets need to calm down and only after that will it be possible to look at all the information in a new way. It is now clear that market participants are in a very agitated state due to the political chaos that is now present in the United States. Therefore, the mood of large traders can change quickly and dramatically.
The fundamental background for the British pound remains sharply negative, while the currency itself continues to grow. This case just clearly shows that it is not statistics or foundation that move pairs in the foreign exchange market, but the traders. Even if the news speaks about one thing, it does not mean that traders will always act according to them. For example, the House of Lords did not vote "for" a bill that violates the agreement with the European Union on Brexit. Is this news good or bad? Good, but, on the other hand, it should not have existed at all if Prime Minister Boris Johnson had not initiated this bill, because of which the pound should have become cheaper and cheaper in due time. And so it turns out that Johnson did poorly at first, and now the House of Lords is trying to return everything to the state as it was before. Negotiations between Brussels and London will continue beyond this week, at the end of which Johnson set a deadline. Another deadline. One of the high-ranking EU officials said that the parties are unlikely to be able to reach a consensus by the end of the week, perhaps it will be done next week. It might have seemed that this was a real hope for a deal, but the same official also made an important assumption: "if there is no failure in the negotiations." Thus, failure is still possible and highly probable.
The UK is set to publish important data on GDP for September, for the third quarter, as well as industrial production for September. Forecasts predict that the main indicator of the economy will grow by 15.8%, which is not that much after falling by 19.8% in the second quarter. If the real figures turn out worse, then the pound may continue to fall. Bank of England Andrew Bailey is set to deliver a speech today, he could provide interesting information.
We have two trading ideas for November 12:
1) Buyers for the pound/dollar pair were unable to overcome the resistance level of 1.3266. Thus, we recommend buying the pair if the pair rebounds from the Kijun-sen line (1.3187) while aiming for the resistance levels of 1.3266 and 1.3382. Take Profit in this case will be from 50 to 160 points.
2) Sellers do not currently own the initiative in the market. If the price settles below the 1.3160 ]-1.3184 area, you can try to sell the pound/dollar pair while aiming for the trend line. Take Profit in this case can be up to 30 points. But it is better to wait until the trend line is overcome and sell the pair more confidently with the targets Senkou Span B line (1.3030) and support level of 1.2943. Take Profit in this case will be from 60 to 140 points.
Hot forecast and trading signals for EUR/USD
Explanations for illustrations:
Support and Resistance Levels are the levels that serve as targets when buying or selling the pair. You can place Take Profit near these levels.
Kijun-sen and Senkou Span B lines are lines of the Ichimoku indicator transferred to the hourly timeframe from the 4-hour one.
Support and resistance areas are areas from which the price has repeatedly rebounded off.
Yellow lines are trend lines, trend channels and any other technical patterns.
Indicator 1 on the COT charts is the size of the net position of each category of traders.
Indicator 2 on the COT charts is the size of the net position for the "non-commercial" group.