empty
 
 
20.10.2021 10:50 AM
Trading plan for starters of EUR/USD and GBP/USD on October 20, 2021

Here are the details of the economic calendar for October 19:

The United States published its real estate market data yesterday, where the indicators came out very bad. The number of construction permits issued fell by 7.7% in the period of September, and the volume of construction of new homes also did so by 1.6%.

The US dollar came under pressure again from sellers.

Analysis of trading charts from October 19:

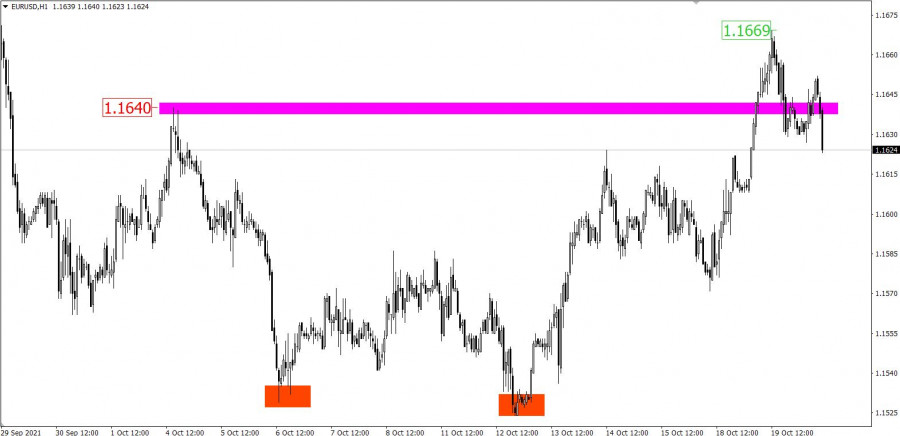
The EUR/USD pair resumed its upward course after a short stop. This led to an update of the local high (1.1640) of October 4. As a variable resistance level, the level of 1.1669 stood in the way of buyers. After that, a technical pullback occurred.

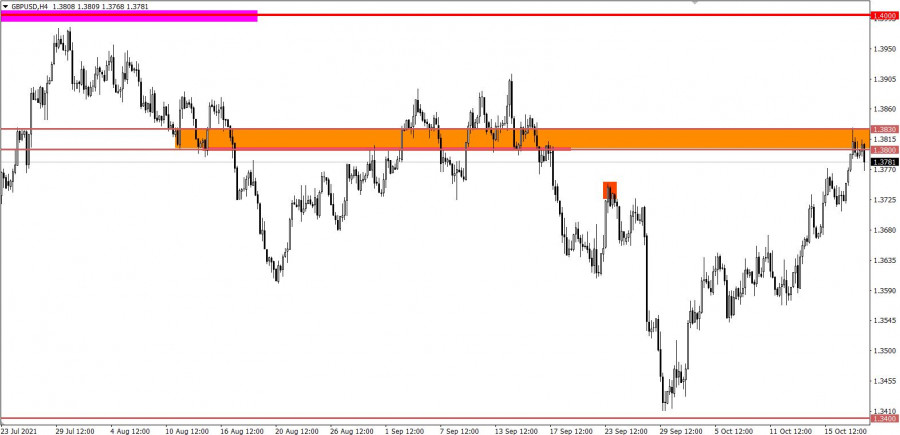
As expected, the GBP/USD pair extended the correction towards the resistance level of 1.3800/1.3830, where there was a reduction in the volume of long positions. This led to a price rebound along a downward course.

This image is no longer relevant

October 20 economic calendar:

The UK's final inflation data has already been published this morning, where a slowdown in growth from 3.2% to 3.1% was recorded.

The pound sterling reacted negatively to the statistics, so the quotes weakened.

Similar data will be published in Europe at 9:00 Universal time, where consumer prices may rise from 3% to 3.4%.

Trading plan for EUR/USD on October 20:

The first signal of a change in trading interests might be a technical pullback.

In this situation, the most appropriate trading tactic is a breakout of one or another control value. This may indicate a local price movement.

  • Buy positions should be considered after keeping the price above the level of 1.1670.
  • Sell positions should be considered after keeping the price below the level of 1.1620.

This image is no longer relevant

Trading plan for GBP/USD on October 20:

It can be assumed that the corrective move for the pound is coming to an end, where the resistance area is 1.3800/1.3830. If expectations coincide, it is quite possible to consider the pound's gradual weakening. As the first stage, it is possible to move towards the level of 1.3730.

This image is no longer relevant

What is reflected in the trading charts?

A candlestick chart view is graphical rectangles of white and black light, with sticks on top and bottom. When analyzing each candle in detail, you will see its characteristics of a relative period: the opening price, closing price, and maximum and minimum prices.

Horizontal levels are price coordinates, relative to which a stop or a price reversal may occur. These levels are called support and resistance in the market.

Circles and rectangles are highlighted examples where the price of the story unfolded. This color selection indicates horizontal lines that may put pressure on the quote in the future.

The up/down arrows are the reference points of the possible price direction in the future.

Gven Podolsky,
الخبير التحليلي لدى شركة إنستافوركس
© 2007-2024
كسب عائد من تغيرات أسعار العملات المشفرة مع إنستافوركس.
قم بتحميل منصة التداول ميتاتريدر 4 وافتح أول صفقة.
  • Grand Choice
    Contest by
    InstaForex
    InstaForex always strives to help you
    fulfill your biggest dreams.
    انضم إلى المسابقة
  • إيداع الحظ
    قم بإيداع 3,000 دولار في حسابك واحصل على $1,000 وأكثر من ذالك!
    في أبريل نحن نقدم باليانصيب $1,000 ضمن حملة إيداع الحظ!
    احصل على فرصة للفوز من خلال إيداع 3,000 دولار في حساب تداول. بعد أن استوفيت هذا الشرط، تصبح مشاركًا في الحملة.
    انضم إلى المسابقة
  • تداول بحكمة، اربح جهازا
    قم بتعبئة حسابك بمبلغ لا يقل عن 500 دولار ، واشترك في المسابقة ، واحصل على فرصة للفوز بأجهزة الجوال.
    انضم إلى المسابقة
  • بونص 100٪
    فرصتك الفريدة للحصول على بونص 100٪ على إيداعك
    احصل على بونص
  • بونص 55٪
    تقدم بطلب للحصول على بونص 55٪ على كل إيداع
    احصل على بونص
  • بونص 30٪
    احصل على بونص 30٪ في كل مرة تقوم فيها بتعبئة حسابك
    احصل على بونص

المقالات الموصى بها

لا تستطيع التحدث الآن؟
اطرح سؤالك في الدردشة.
Widget callback