empty
 
 
29.10.2021 08:32 AM
GBP/USD breaking forecast on October 29, 2021

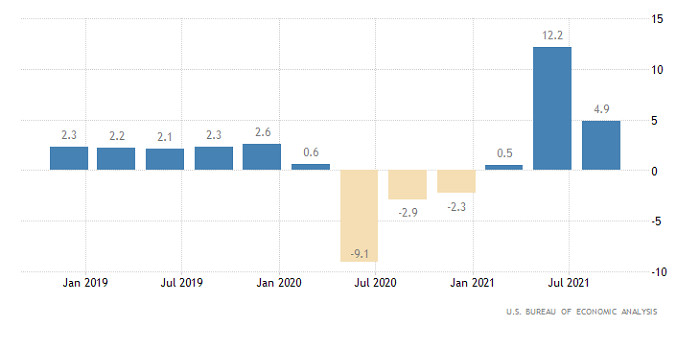
The pound sterling went up after the release of macroeconomic reports in the United States that missed market expectations. Thus, the Q3 GDP growth rate in the US slowed down to 4.9% from 12.2% y/y. The American economy expanded by 2% on quarter in Q3 2021, well below market forecasts of 2.7%. Based on several indicators published on a monthly basis, it has already been clear that the US economy is expanding faster than GDP data shows. It turned out that within the past two months, demand for the US dollar among investors was very high, and it became necessary to balance it, which led to a noticeable weakening of the greenback. At the same time, it could have been an even sharper drop, if not for jobless claims that came out better than market forecasts. In particular, initial claims decreased by 10K, well above market expectations of 6K. Meanwhile, continuing claims declined by 237K. The reading was projected to drop by 160K.

United States GDP Growth Rate:

This image is no longer relevant

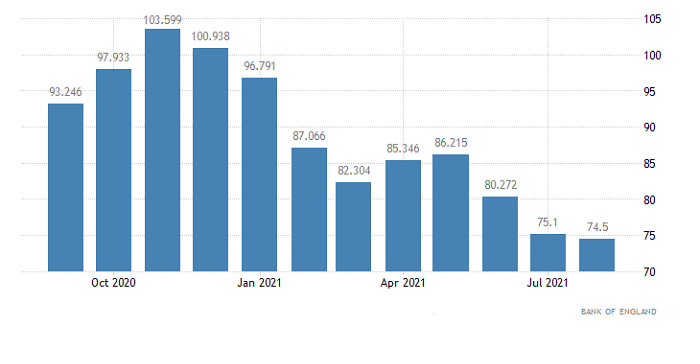
Data on the UK's mortgage market is likely to exert pressure on the sterling today. Indeed, it accounts for at least one-fifth of the British economy. Anyway, mortgage approvals are estimated to drop to 71K versus 74.5K. At the same time, mortgage lending is projected to fall to GBP 5.1 billion from GBP 5.3 billion in the previous month. In other words, one of the key economic sectors in the US is slowing down. A possible increase in consumer credit by GBP 0.8 billion from GBP 0.4 billion in the previous month could hardly change anything. This data could only somehow offset negative consequences for the pound.

United Kingdom Mortage Approvals:

This image is no longer relevant

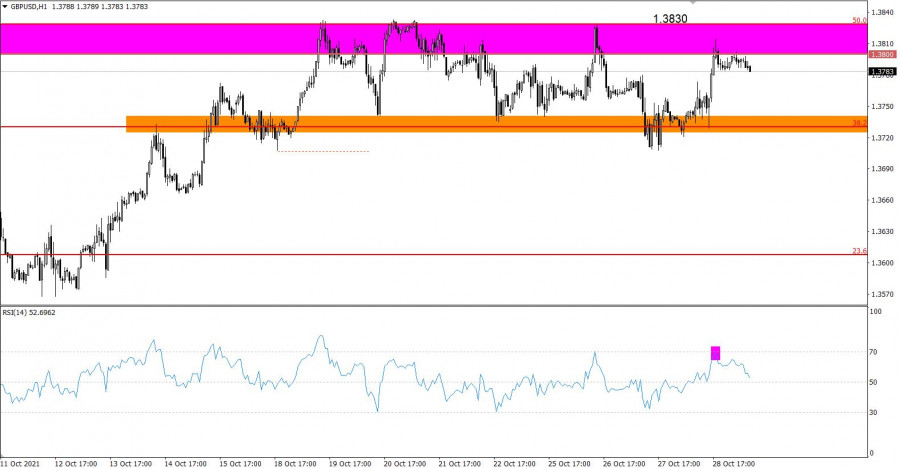
An attempt to reverse the trend failed as soon as the price returned in the resistance range of 1.3800/1.3830. The swing low as of October 18 is seen as a pivot point.

The 38.2 Fibonacci level confirms the pivot point, signaling a trading flat in the range of 1.3730/1.3830.

The Relative Strength Index (RSI) shows that the price is approaching the area of resistance by touching the overbought zone on the H1 chart.

On the daily chart, there is a downward trend that started in early June. A corrective move has not led to a reversal. As a result, the correction is being replaced by a flat.

Outlook:

The resistance zone of 1.3800/1.3830 is likely to continue exerting pressure on the pair, which could lead to a flat in the range of 1.3730/1.3830.

In terms of complex indicator analysis, technical indicators are signaling to sell the pair for short-term and intraday trading as the price has bounced from the resistance zone.

This image is no longer relevant

Dean Leo,
الخبير التحليلي لدى شركة إنستافوركس
© 2007-2024
كسب عائد من تغيرات أسعار العملات المشفرة مع إنستافوركس.
قم بتحميل منصة التداول ميتاتريدر 4 وافتح أول صفقة.
  • Grand Choice
    Contest by
    InstaForex
    InstaForex always strives to help you
    fulfill your biggest dreams.
    انضم إلى المسابقة
  • إيداع الحظ
    قم بإيداع 3,000 دولار في حسابك واحصل على $10,000 وأكثر من ذالك!
    في ديسمبر نحن نقدم باليانصيب $10,000 ضمن حملة إيداع الحظ!
    احصل على فرصة للفوز من خلال إيداع 3,000 دولار في حساب تداول. بعد أن استوفيت هذا الشرط، تصبح مشاركًا في الحملة.
    انضم إلى المسابقة
  • تداول بحكمة، اربح جهازا
    قم بتعبئة حسابك بمبلغ لا يقل عن 500 دولار ، واشترك في المسابقة ، واحصل على فرصة للفوز بأجهزة الجوال.
    انضم إلى المسابقة
  • بونص 100٪
    فرصتك الفريدة للحصول على بونص 100٪ على إيداعك
    احصل على بونص
  • بونص 55٪
    تقدم بطلب للحصول على بونص 55٪ على كل إيداع
    احصل على بونص
  • بونص 30٪
    احصل على بونص 30٪ في كل مرة تقوم فيها بتعبئة حسابك
    احصل على بونص

المقالات الموصى بها

لا تستطيع التحدث الآن؟
اطرح سؤالك في الدردشة.
Widget callback