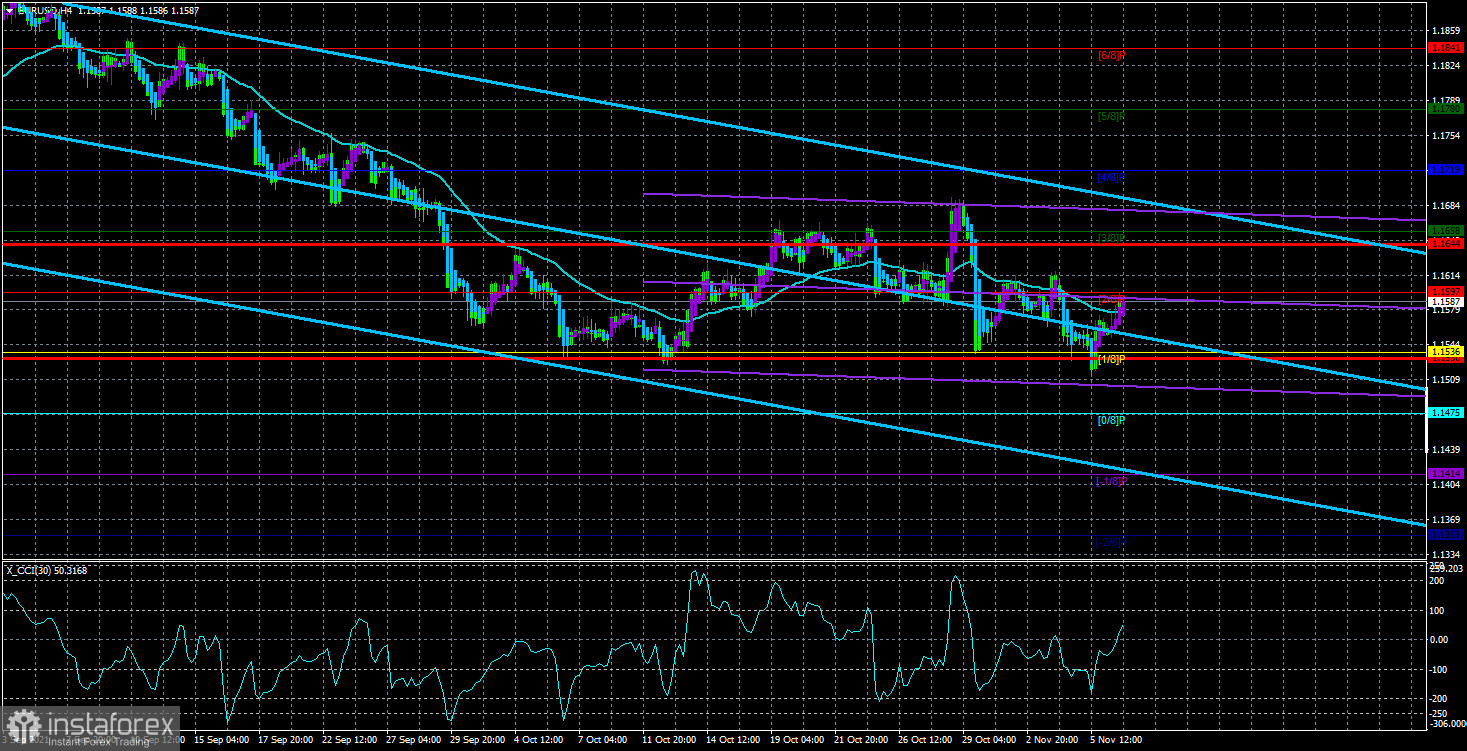
H4 time frame
Technical data:
Upper channel line - downtrend
Lower channel line - downtrend
Moving average (20-day period, smoothed) - sideways movement
On Monday, there was nothing surprising about EUR/USD's dynamics since the macroeconomic calendar was empty. The currency pair also showed a similar performance during the weekend. On Monday, however, it was reported that Fed Chair Jerome Powell was going to deliver a speech. Nevertheless, his words had no effect on the market. After all, they usually trade coolly on Mondays. Now, let's switch to the H4 time frame. Technically, there are several important moments there. Firstly, the price has failed to break the Murray level 1/8 (1.1536). This means that the pair has been moving in the sideways channel for about a month. To be more accurate, the quote has been traded in the range of 1.1536 and 1.1658 - in an approximately 120-pips channel. Lastly, there is no trend. The pair attempts to rise from time to time and volatility remains very low. The pair failed to leave the channel after the FOMC meeting last week, not to mention the ECB meeting a week earlier. Fluctuations occur in the market occasionally. However, the pair mainly moves by 40-50 pips a day, providing a net movement of 15-20 pips a day.
Markets are now contemplating who will become the new Chairman of the Federal Reserve since Jerome Powell's term is up in early 2022. Perhaps President Biden decides to reappoint the Republican who has been responsible for monetary policy and the economy for 4 years. Meanwhile, it does not matter for the greenback who is going to be at the helm of the Fed. Of course, it is an important issue, but it is unlikely to affect the dollar the same way the debt ceiling impasse did. Besides, the debt limit standoff still remains unresolved. The Treasury Department has enough funds to pay its bills only throughout December 3. In other words, Congress has to pass a new bill to either raise the debt limit or freeze it for a while before the deadline. Congress has just 25 days left to make a final decision that will be valid for a year or two, and not for a month and a half.
At the same time, markets are awaiting the US inflation report scheduled for Wednesday. The US CPI could soar to its 30-year high of 5.8% y/y. Indeed, inflation could accelerate further. Meanwhile, the Federal Reserve keeps saying the high inflation is temporary. However, many experts openly express their concerns and talk about a serious overheating of the economy. It is going to be very challenging to bring inflation under control now, they say. Perhaps the Fed will have to raise interest rates sooner to stop inflation growth as well as to accelerate the pace of QE tapering. Anyway, any monetary policy tightening is a potentially positive factor for the greenback. At the same time, the Fed and the government need a weaker dollar to deal with its almost $30 trillion debt.
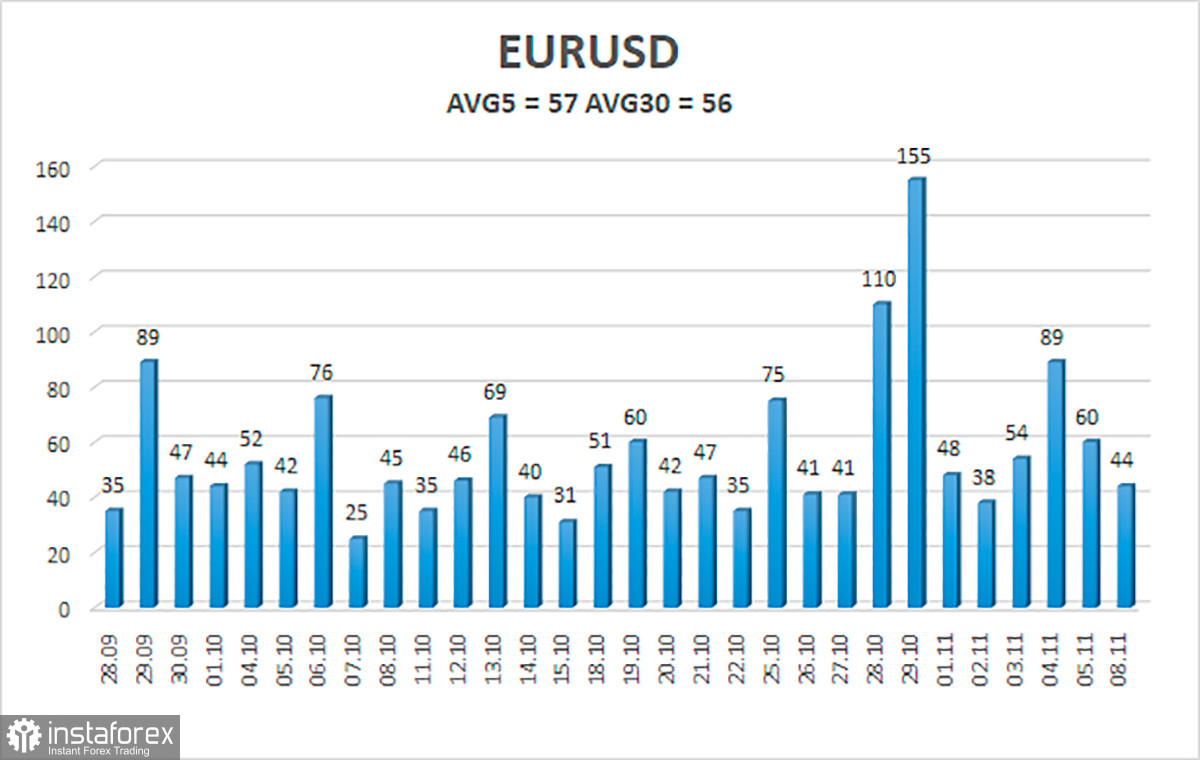
On November 9, EUR/USD volatility is 57 pips. Today, the pair is expected to be in the range of 1.1530/1.1644. Heiken Ashi's reversal is likely to indicate a downtrend.
Closest support levels
S1 – 1.1536
S2 – 1.1475
S3 – 1.1414
Closest resistance levels
R1 – 1.1597
R2 – 1.1658
R3 – 1.1719
Outlook
EUR/USD has consolidated above the MA. Long positions could be opened with a target at 1.1644 as long as the price is above the moving average. Meanwhile, short positions could be considered if the price consolidates below the MA with the target at 1.1530. Notably, the pair is now moving sideways.
Indicator description:
Linear Regression Line helps identify the current trend. If both lines move in the same direction, the trend is strong.
Moving Average (20-day, smoothed) defines a short-term and the current trend.
Murray levels are target levels for trends and corrections.
Volatility levels (red lines) reflect a possible price channel the pair is likely to trade the next day based on the current volatility indicators.
CCI indicator: when the indicator is in the oversold area (below 250) or in the overbought zone (above 250), it means that a trend reversal is likely to occur soon.