GBP/USD 5M
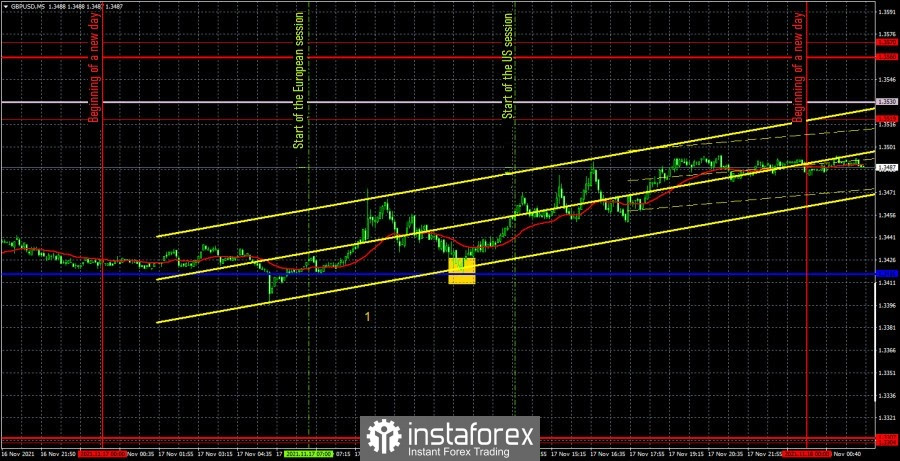
The GBP/USD pair tried to continue the upward correction on Wednesday. Volatility was not too high, nevertheless, the pair passed about 100 points in a day. However, as in the case of the euro, a rather strong movement happened at the Asian trading session, which casts doubt on the assumption about the reasons behind European Central Bank President Christine Lagarde's speech. Nevertheless, we still do not recommend trading at night, so you should have started looking at trading signals in the morning. It should be noted right away that we have placed the critical line in the chart at the level of 1.3416, although it moved several times over the past day. However, we put it where the only signal of the day was formed. On the 4-hour TF, you can clearly see that a buy signal was formed at this price value. On our TF, it is marked with a rectangle, after which the price resumed its upward movement and in total went upward after it by around 50 points. Since the pair did not work out a single level or line during the day, a long position should have been manually closed in the late afternoon. The profit was 40-50 points. We also note that in the morning the UK published a report on inflation for October, which rose to 4.2% y/y, although the markets were expecting an acceleration only to 3.9%. It is difficult to say exactly how traders reacted to this report, because at the time of publication, the British currency was already rising in price, and half an hour after its release, the price began to fall. However, strong inflation in Britain can be considered a bullish factor for the pound, just like strong inflation in the US for the dollar. Thus, the overall growth of the pound/dollar pair on Wednesday, from our point of view, is natural.
GBP/USD 1H
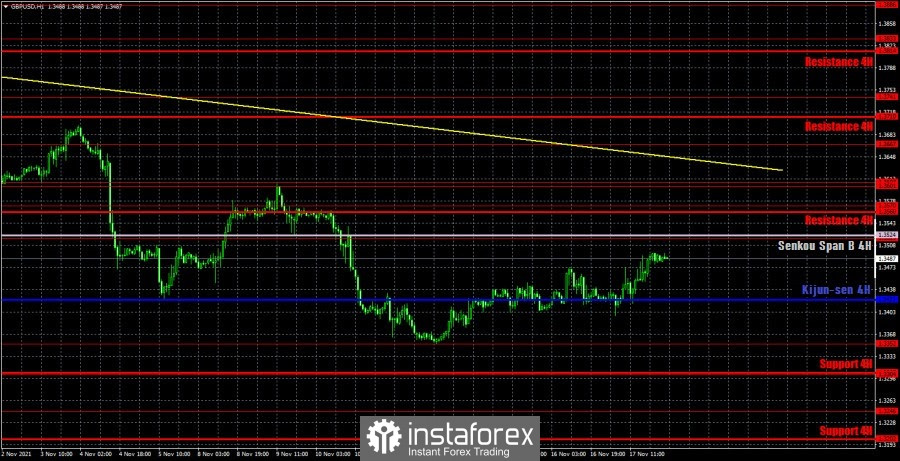
The pound/dollar pair continues to correct on the hourly timeframe. The correction is not strong, and the downtrend line is very far away. The first strong obstacle on the way of the bulls is the Senkou Span B line. Recall that earlier the price completed a correction near the critical line several times, and now it has already overcome it. And although the upward movement is not strong yet, if the Senkou Span B is overcome, the chances for the strengthening of the pound will increase. We distinguish the following important levels on November 18: 1.3304, 1.3352, 1.3519, 1.3570, 1.3601 - 1.3607. Senkou Span B (1.3524) and Kijun-sen (1.3422) lines can also be signal sources. Signals can be rebounds and breakthroughs of these levels and lines. It is recommended to set the Stop Loss level at breakeven when the price passes 20 points in the right direction. The Ichimoku indicator lines can move during the day, which should be taken into account when looking for trading signals. No major reports will be released on Thursday in the UK or the United States. There will be several FOMC gigs in the US throughout the day, but this week they will be speaking in huge numbers every day. Their rhetoric often contradicts each other, so it is impossible to draw an unambiguous conclusion about future changes in the Federal Reserve's monetary policy.
We recommend you to familiarize yourself:
Overview of the EUR/USD pair. November 18. The European Central Bank continues to push for the euro.
Overview of the GBP/USD pair. November 18. Britain urges the EU not to start a trade war.
Forecast and trading signals for EUR/USD for November 18. Detailed analysis of the movement of the pair and trade deals.
COT report

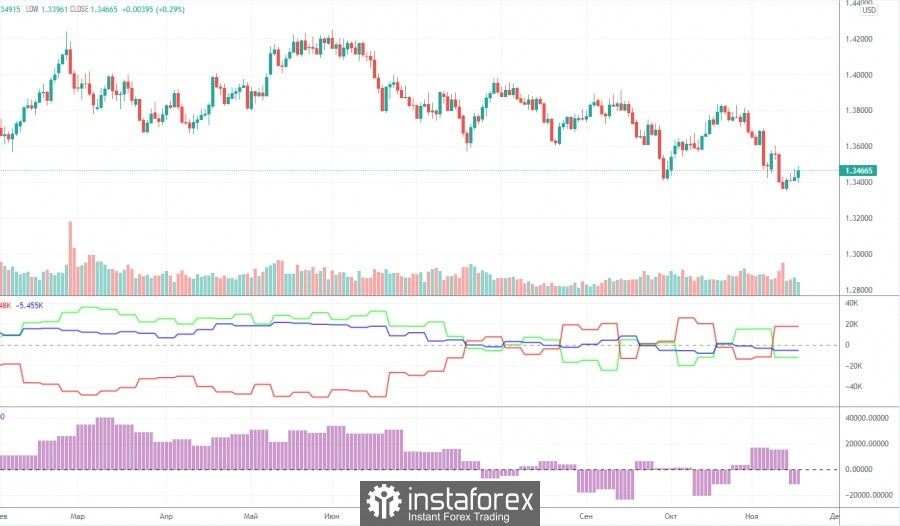
The mood of professional traders became much more bullish during the last reporting week (November 2-8). However, this should not come as a surprise, as the mood of the major players has been constantly changing over the past few months, which is perfectly reflected in the first indicator in the chart above. The green and red lines, which represent the net positions (in other words, the mood) of non-commercial and commercial traders, constantly change direction of movement and constantly change their position relative to the zero level. That is, to put it simply, both of the most important groups of traders are constantly changing their moods. For example, during the last reporting week, professional traders opened as many as 24,000 sell contracts (shorts) and closed 2,500 buy contracts (longs). Thus, their net position decreased by 26.5 thousand. And this despite the fact that in total they have about 130,000 contracts open now. Apart from the recent changes, the bearish mood among professional players has increased by about a quarter. At the same time, the net position is still close to zero, which is more indicative of the neutrality of the sentiment. In general, it is now a thankless task to predict further movements in the pound using COT reports. You can also compare the readings of the first indicator for the euro and the same for the pound. The difference is very strong. If in the case of the euro it is possible to build a trend, then with the pound it is not. In part, the movement of the pound/dollar pair corresponds to the mood of traders in the market, as the pair is constantly changing direction, which is clearly seen in the chart of the 24-hour timeframe above.
Explanations for the chart:
Support and Resistance Levels are the levels that serve as targets when buying or selling the pair. You can place Take Profit near these levels.
Kijun-sen and Senkou Span B lines are lines of the Ichimoku indicator transferred to the hourly timeframe from the 4-hour one.
Support and resistance areas are areas from which the price has repeatedly rebounded off.
Yellow lines are trend lines, trend channels and any other technical patterns.
Indicator 1 on the COT charts is the size of the net position of each category of traders.
Indicator 2 on the COT charts is the size of the net position for the non-commercial group.