EUR/USD 5M
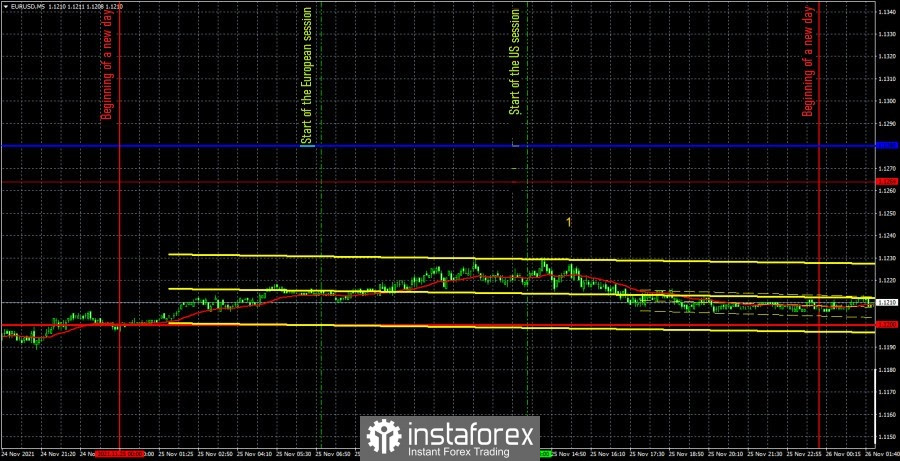
During the fourth trading day of the week, the EUR/USD pair has been trading in its best traditions for the last, probably, six months. Recall that the pair has shown a more or less strong and trending movement only in the last few weeks, and before that, every 3 or 4 days out of five passed with low volatility and with the complete absence of an intraday trend. Thus, it is worth hoping that those times do not return. There were no important and interesting macroeconomic events in either the US or the European Union during the penultimate trading day of the week. It was Thanksgiving Day in America yesterday, so US traders were not as active. Another speech by European Central Bank President Christine Lagarde took place in the European Union, which once again did not give anything new. Recall that all of Lagarde's recent speeches were extremely dovish, which only finished off the European currency. In light of all of the above, the volatility in the European and US trading sessions was... a little more than 20 points. The total volatility of the day is about 30 points. It is not surprising that not a single trading signal was formed during the day, and this is even very good, since a lot of false signals could have been formed in such a flat if the price had been near some level or line at that time. But there were no important levels and lines near the price yesterday, so no signal was formed.
EUR/USD 1H

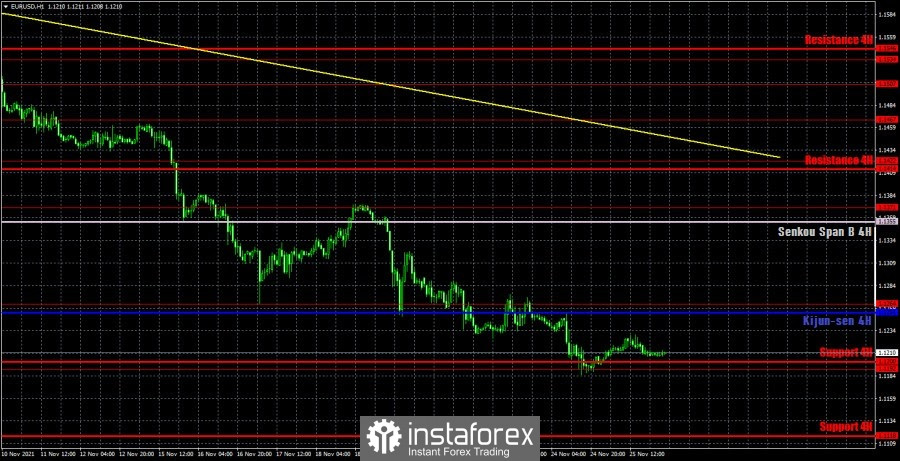
The downward movement continues on the hourly timeframe and it is clearly visible. The price is not even trying to approach the downward trend line, we are seeing such a strong movement now. Not even so much strong as stable and daily. Therefore, over the past two weeks, the pair has decreased by 400 points, which is quite a lot for it. At the moment, the quotes are located below the critical line and rebounded from the level of 1.1192. Therefore, there are some illusory chances of a correction, but even on such a semi-weekend day as yesterday, the markets did not find a reason to close some of the short positions. We highlight the following levels for trading on Friday - 1.1192, 1.1264, 1.1371, as well as the Senkou Span B(1.1436) and Kijun-sen(1.1280) lines. The lines of the Ichimoku indicator may change their position during the day, which should be taken into account when searching for trading signals. Signals can be rebounds or breakthroughs of these levels and lines. Do not forget about placing a Stop Loss order at breakeven if the price moves 15 points in the right direction. This will protect you against possible losses if the signal turns out to be false. Another speech by Lagarde will take place in the European Union on November 26. As it is easy to guess, we do not expect anything new from today's speech of the head of the ECB. Theoretically, it is possible to receive new information, but what can it be now? Lagarde speaks so often that the economy does not have time to change anything in order for it to be analyzed and commented on.
We recommend you to familiarize yourself:
Overview of the EUR/USD pair. November 26. European Union: the economic situation is deteriorating, the fourth "wave" is strengthening, the euro is falling.
Overview of the GBP/USD pair. November 26. Thanksgiving is not a reason to rest. Trade negotiations in Northern Ireland will drag on for several months.
Forecast and trading signals for GBP/USD for November 26. Detailed analysis of the movement of the pair and trade deals.
Analysis of the COT report

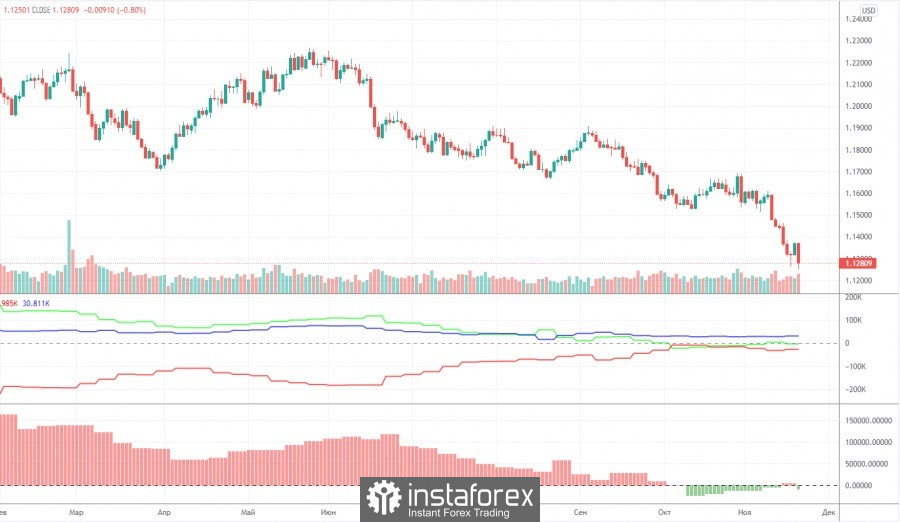
The mood of non-commercial traders changed quite significantly during the last reporting week (November 9-15). A group of non-commercial traders opened 7,000 buy contracts (longs) and 20,500 sell contracts (shorts) during the week. Thus, the net position for professional traders decreased by 13,500, and the mood became more "bearish". It should be noted that the European currency has dropped quite seriously over the past few weeks. But the net position for the "non-commercial" group, starting from October, practically does not change. This is signaled by the green line of the first indicator in the chart above. Almost all this time, it has been near the zero level, indicating the absence of serious changes in the mood of major players. Thus, if the general trend remains the same - over the past ten months, large players have seriously reduced the number of longs and increased the number of shorts, then in the past few weeks nothing of the kind has been observed, and the European currency was still falling. This suggests that what is happening on the market now does not quite correspond to the actions of large players. The second indicator (the net position for professional traders in the form of a histogram) shows that in the last six weeks the mood of traders has become less bearish, that is, in theory, at this time the euro should have been growing, not falling. Thus, if we draw a conclusion only on the basis of the Commitment of Traders (COT) reports, then a further fall in the euro currency is completely unclear.
Explanations for the chart:
Support and Resistance Levels are the levels that serve as targets when buying or selling the pair. You can place Take Profit near these levels.
Kijun-sen and Senkou Span B lines are lines of the Ichimoku indicator transferred to the hourly timeframe from the 4-hour one.
Support and resistance areas are areas from which the price has repeatedly rebounded off.
Yellow lines are trend lines, trend channels and any other technical patterns.
Indicator 1 on the COT charts is the size of the net position of each category of traders.
Indicator 2 on the COT charts is the size of the net position for the non-commercial group.