EUR/USD 5M
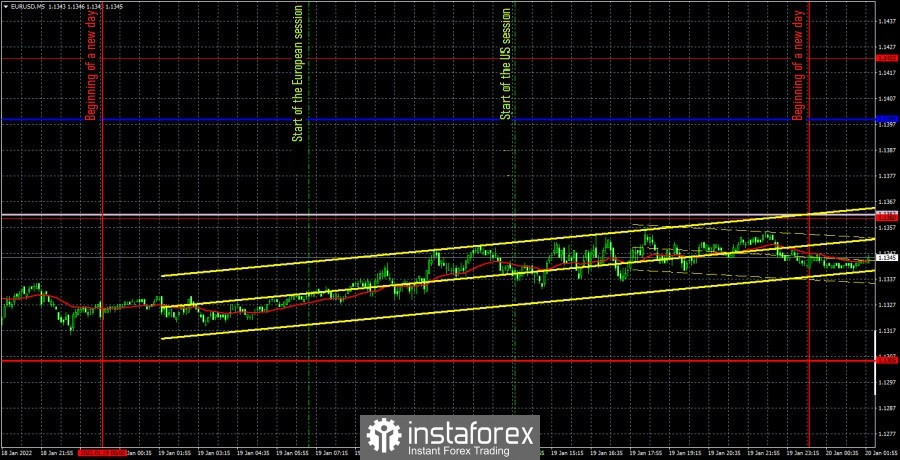
The EUR/USD pair passed around 40 points from the low to the high of the day on Wednesday. That is, the movement was very weak, but at the same time it was upward. Since the fall of the European currency has been observed in recent days, we characterize this movement as a correction. A very weak correction. However, the price cannot constantly move in one direction. The macroeconomic background was absent again on Wednesday. No significant report or important event. However, this is perfectly clear from the movement of the euro/dollar pair itself. However, we would like to note that now the pair can generally return to the horizontal channel. The chart below shows that the pair is between the levels of 1.1234 and 1.1360 again. Or between the levels of 1.1274 and 1.1360, which represent another horizontal channel. Of course, entering this range does not necessarily mean that the flat will now resume. The price can overcome it very quickly and continue to fall. We expect that in the near future there will be a decline to the level of 1.1234, which the bears will try to overcome again. Moreover, traders shamelessly ignored most of the "foundation" of recent weeks. Consequently, they act according to their own plan and do not pay attention to statistics and events.
Since the movement was very weak on Wednesday, it was not necessary to count on the formation of many strong signals. Not a single one was formed for the entire day, since the price could not work out either the lines of the Ichimoku indicator or the extreme levels. Therefore, trade deals should not have been opened yesterday.
We recommend to familiarize yourself with:
Forecast and trading signals for GBP/USD on January 20. Detailed analysis of the movement of the pair and trading transactions.
COT report
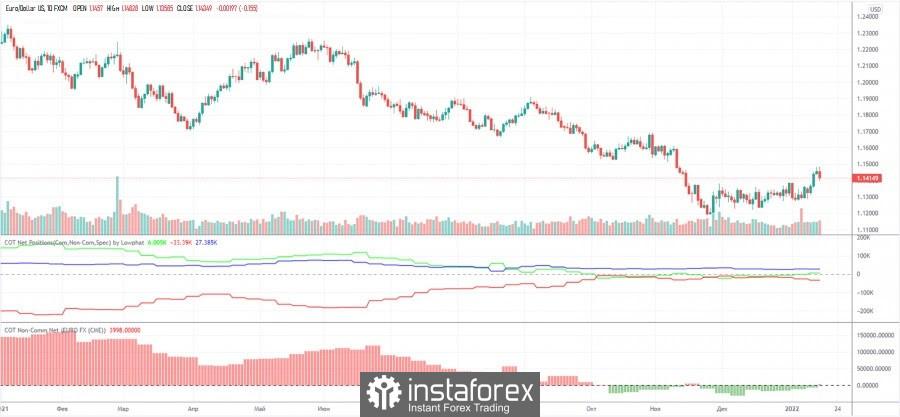
Recent Commitment of Traders (COT) reports have shown that the mood of professional traders is practically unchanged. The green and red lines of the indicators, which indicate the net positions of the most important groups of traders "non-commercial" and "commercial", practically do not move and are near the zero mark. This means that the mood is now as neutral as possible, and the general trend of mood changes still remains downward. Nevertheless, we recall that in most cases the trend movement ends when the red and green lines move away from each other by a considerable distance, which is not the case now. Thus, COT reports now signal that the euro may continue to fall. This coincides with our expectations, as the US fundamentals remain very strong. At the same time, the upward movement in the last week may simply be an "acceleration" in order to cross the important level of 1.1230, which the bears have not been able to overcome for a month and a half.
EUR/USD 1H
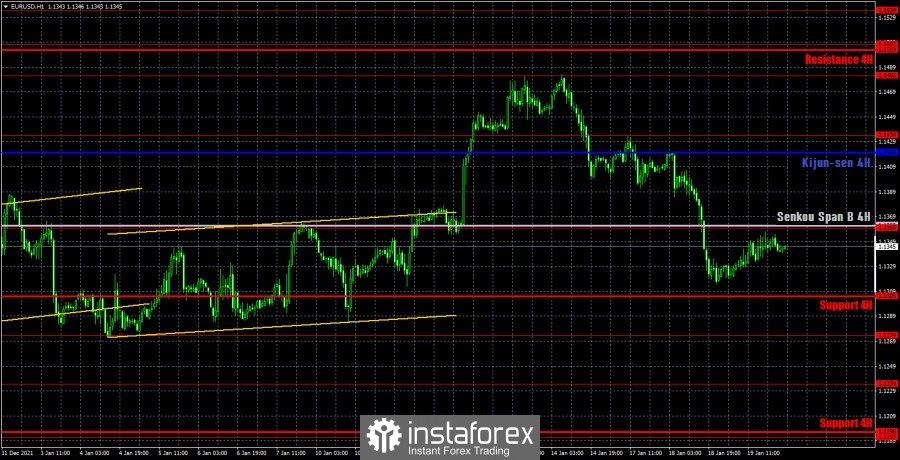
It is also clearly visible on the hourly timeframe that the price began to adjust after a rather noticeable drop. We cannot form either a trend line or a channel yet, as the movement is short-lived. Nevertheless, the price now has support from above in the form of the Senkou Span B. The pair has quite confidently overcome the Ichimoku cloud on the 4-hour TF, so the chances of continuing the fall are increasing. There is also an important level of 1.1360 near the Senkou Span B line, which creates additional resistance for bulls. We allocate the following levels for trading on Thursday - 1.1274, 1.1360, 1.1434, as well as the Senkou Span B (1.1362) and Kijun-sen (1.1420) lines. The lines of the Ichimoku indicator may change their position during the day, which should be taken into account when searching for trading signals. Signals can be "bounces" and "breakthroughs" of these levels and lines. Do not forget about placing a Stop Loss order at breakeven if the price went in the right direction of 15 points. This will protect against possible losses if the signal turns out to be false. There will be nothing interesting in the European Union and the US on January 20. The consumer price index in the European Union will be its second estimate for December. That is, traders already know that the value has grown to 5%. The report on applications for unemployment benefits in US has not provoked any reaction from traders for a long time. And there won't be anything else to pay attention to today.
Explanations for the chart:
Support and Resistance Levels are the levels that serve as targets when buying or selling the pair. You can place Take Profit near these levels.
Kijun-sen and Senkou Span B lines are lines of the Ichimoku indicator transferred to the hourly timeframe from the 4-hour one.
Support and resistance areas are areas from which the price has repeatedly rebounded off.
Yellow lines are trend lines, trend channels and any other technical patterns.
Indicator 1 on the COT charts is the size of the net position of each category of traders.
Indicator 2 on the COT charts is the size of the net position for the non-commercial group.