After months of suffering, the EUR/USD currency pair finally updated its 20-year lows on Tuesday. Recall that we have frequently stated in recent articles that we have no doubts about updating them. As can be seen, traders did not require robust macroeconomic data or a "foundation" to implement this strategy. Within a few hours on the day following Independence Day in the United States, the European currency dropped approximately 150 points. This movement cannot be described as anything but a collapse. Typically, such movements result in significant fundamental or macroeconomic events, but they did not occur this time.
Why did the European currency perform such a somersault, seemingly without cause? There were sufficient reasons. Recent statements have reiterated that fundamental and geopolitical factors favor the US dollar. However, the pair cannot move in only one direction indefinitely. There should be at least minor adjustments or reversals. There should be periods of consolidation for the pair. All of this has occurred within the past few weeks or even months. It was only a matter of time before the euro currency resumed its downward trend following a pathetic attempt to form a measurable upward correction. Due to the difficult geopolitical situation in Europe, the Fed's aggressive approach to monetary policy, and the ECB's complete passivity, the dollar continues to enjoy the favorable market sentiment. Theoretically, these factors could have a devastating impact on European currencies for an extended period. Recalling that sanctions continue to be imposed against the Russian Federation, the European Union has no choice but to abandon oil and gas, as there are no other levers to exert pressure on Moscow. And sanctions impact the economy of the nation that imposes them. Donald Trump's verification.
The only hope for the euro is the Federal Reserve's monetary policy.
On Tuesday, as on Monday, there was not much to analyze because nothing interesting occurred economically or politically around the world. Traders could consider only one indicator of economic activity in the European Union. He was not responsible for the collapse of the euro and the pound. Does anyone recall that the pair passed 150 points in one direction due to business activity at least once? Such movements do not happen every time, even after central bank meetings. We conclude that the bears' nerves could not withstand the stress. They understood that the bulls would not seize the initiative and would not make dollar purchases. After all, even the corrections we have witnessed over the past few months could have been caused by the bears, who fixed a portion of their profit.
The euro still has no competitive advantage over the US dollar. Since the 20-year lows have been updated and any new decline will update them again, price parity between the dollar and the euro can be considered the objective. It may take a considerable amount of time to resolve, but the trend is now very stable, and the Fed's 0.75 percent rate hike this month may be the final nail in the euro's coffin. Completing the Fed's rate-hiking cycle is the only viable option for saving the euro. However, this is only possible by the end of 2022.
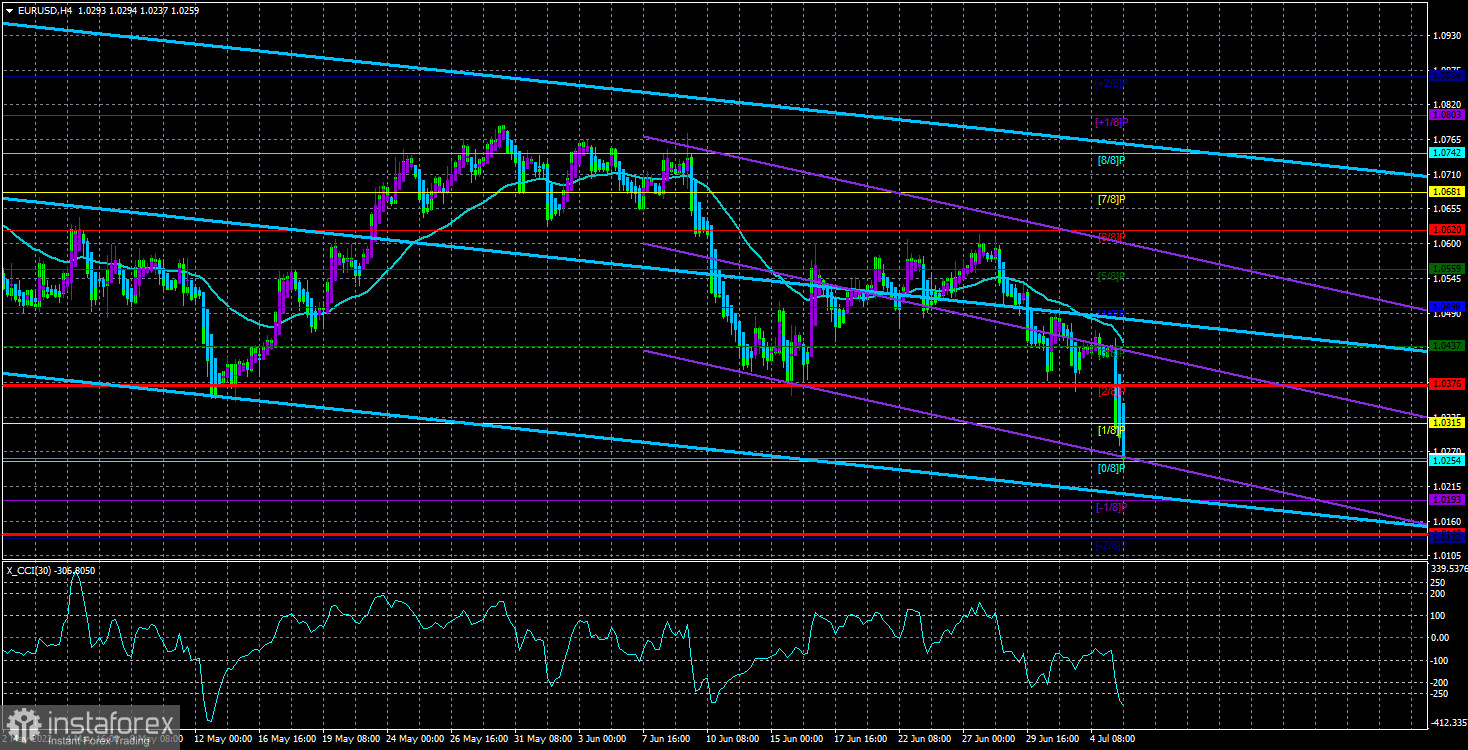
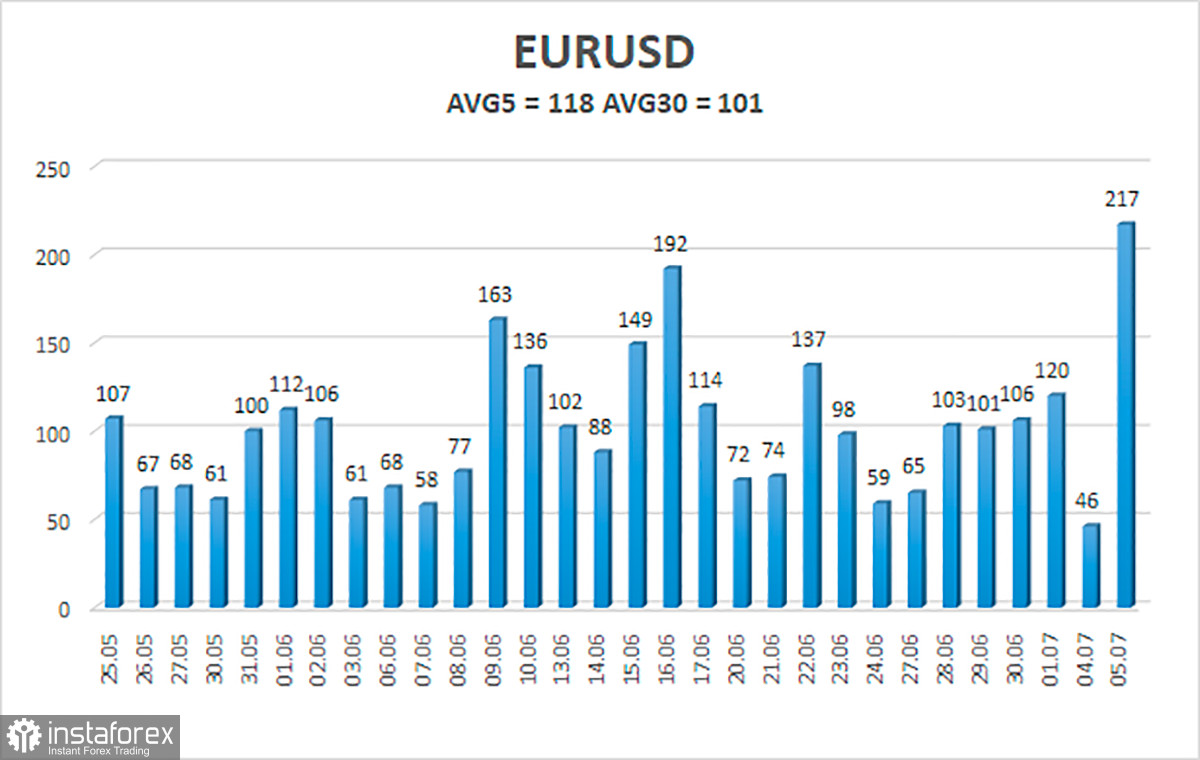
As of July 6, the average volatility of the euro/dollar currency pair over the previous five trading days was 118 points, considered "high." Thus, we anticipate the pair to trade between 1.0140 and 1.0376 today. A reversal of the Heiken Ashi indicator upwards indicates that the pair will attempt to correct it again.
Nearest support levels:
S1 – 1.0254
S2 – 1.0193
S3 – 1.0132
Nearest resistance levels:
R1 – 1.0315
R2 – 1.0376
R3 – 1.0437
Recommendations for Traders:
The EUR/USD pair resumed its downward trend and surpassed the key level of 1.0376. As long as the Heiken Ashi indicator points downwards, it is necessary to maintain short positions with targets between 1.0193 and 1.0140. When the pair is fixed above the moving average with targets of 1.0498 and 1.0559, purchases will become relevant.
Explanations for the figures:
Channels of linear regression – aid in determining the current trend. The trend is currently strong if both are moving in the same direction.
Moving average line (settings 20.0, smoothed) – determines the current short-term trend and trading direction.
Murray levels serve as movement and correction targets.
Volatility levels (red lines) represent the likely price channel the pair will trade within for the next trading day, based on the current volatility indicators.
CCI indicator – its entry into the oversold area (below -250) or the overbought area (above +250) indicates a trend reversal.