empty
 
 
05.12.2022 12:51 PM
Bitcoin continues its recovery movement and consolidates above $17k

There was no significant decrease in trading activity over the weekend. Following the results of Saturday and Sunday, Bitcoin formed two equivalent candles, but the bulls had the final say. Having swallowed Saturday's fall with Sunday's growth, buyers developed an upward movement on Monday.

Bitcoin reached the $17.3k level, where it ran into the $17.3k–$17.6k important resistance level. The total increase in Bitcoin capitalization over the past seven days amounted to 6.8%, and over the past 24 hours, about 2%. The initiative is still on the side of the bulls and is supported by a fundamental positive.

This image is no longer relevant

The Fed's policy is gradually easing, and markets expect a key rate hike of only 50 basis points. Thanks to this and the proximity of the Christmas holidays, the stock market is growing, which is gradually resuming the correlation with BTC.

This image is no longer relevant

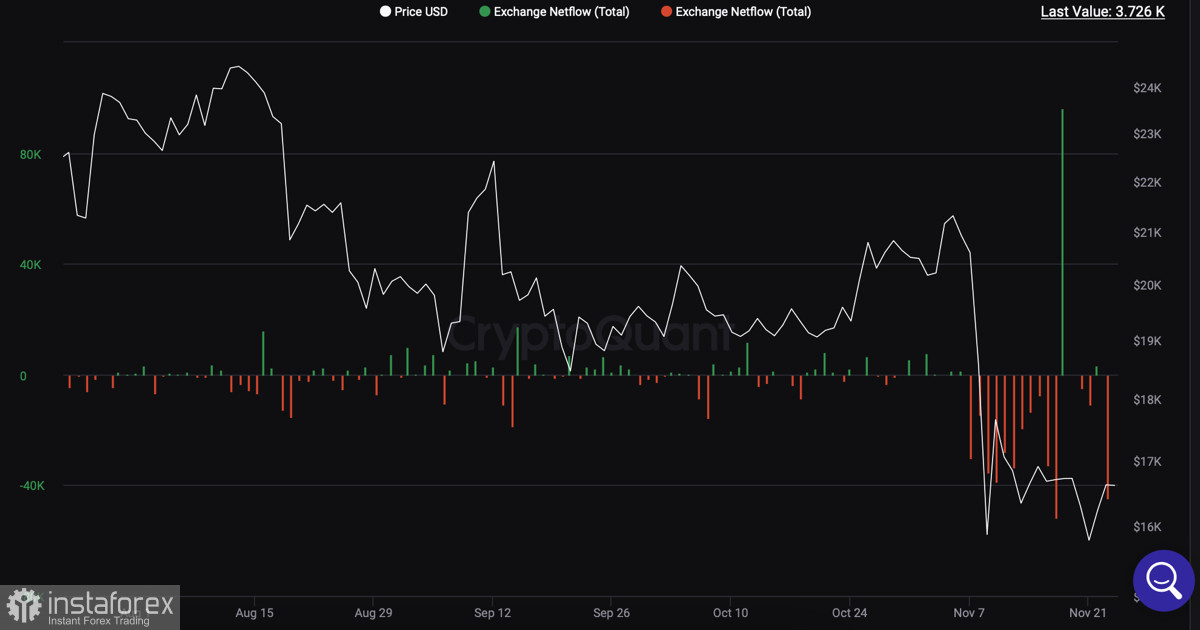
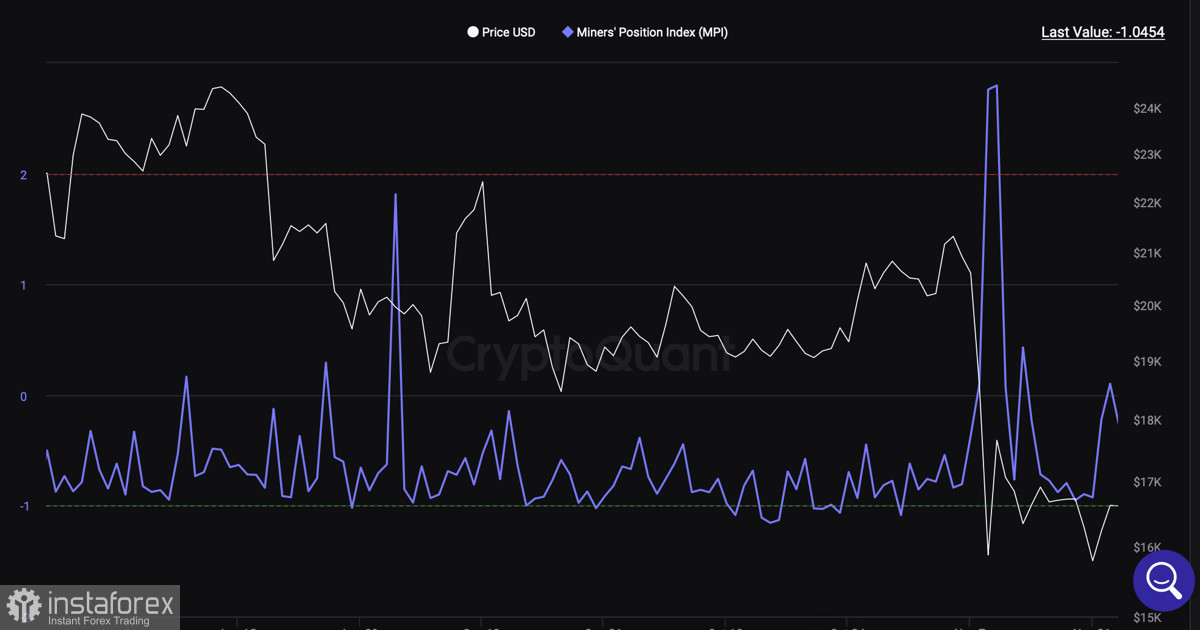
At the same time, the situation remains tense with mining companies that have suffered record losses over the past seven years. Despite this, most of the BTC volumes that end up on the market are absorbed by long-term investors. This can be seen from on-chain indicators, and the weakness of the bears in the current period of price movement.
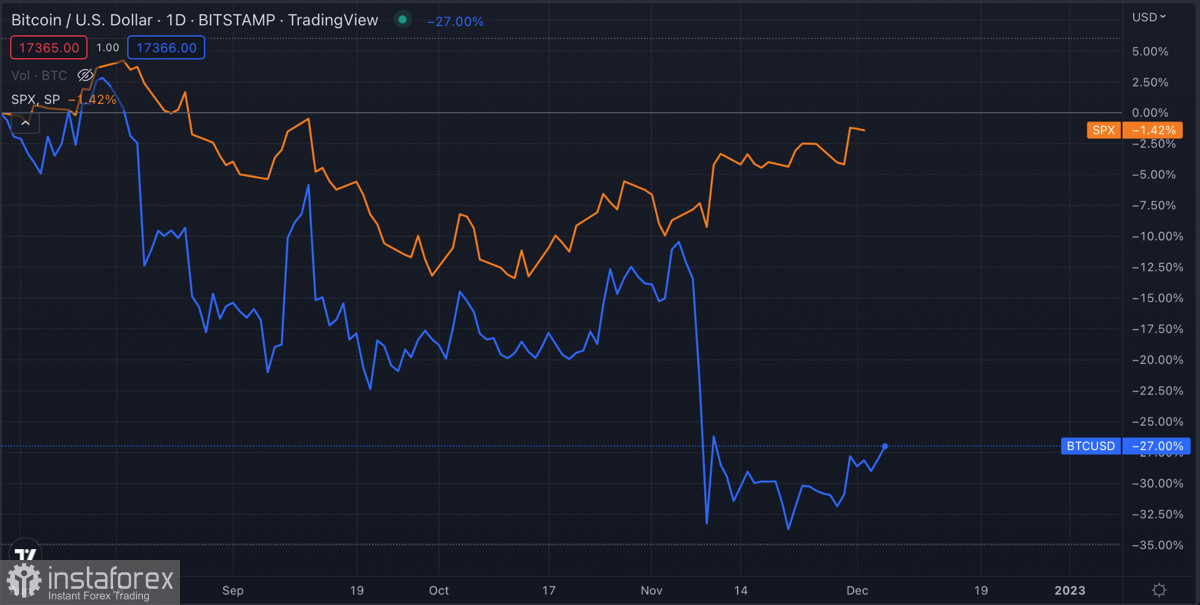
Bitcoin and S&P 500

After the crash of FTX, the correlation between Bitcoin and stock indices was completely broken and reached the level of -0.52. Subsequently, the indicator began to recover, and by the end of last week it reached a level above 0.70.

After the weekend, when the US markets were closed, we again see a correlation. Given the lack of trading activity over the weekend, we should most likely expect an upward movement in the SPX and other stock indices.

This image is no longer relevant

However, do not forget that SPX and BTC strengthen the correlation during a downward trend. Given that Bitcoin has crept up to a difficult resistance level, there is reason to believe that it is the cryptocurrency that will repeat the local downward maneuver of the stock index.
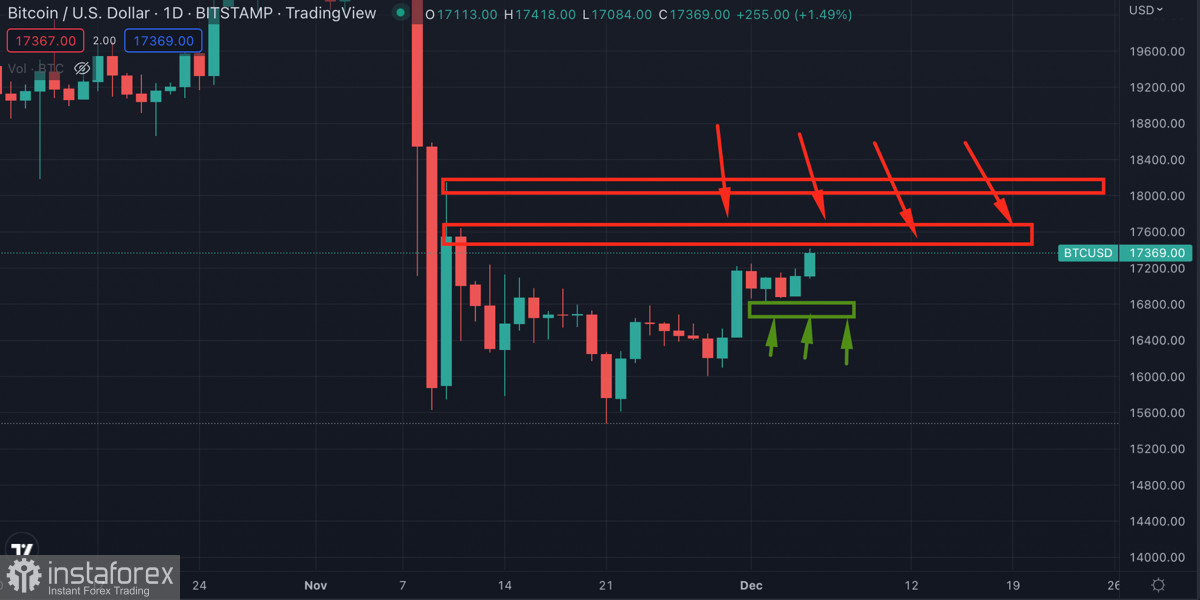
BTC/USD Analysis

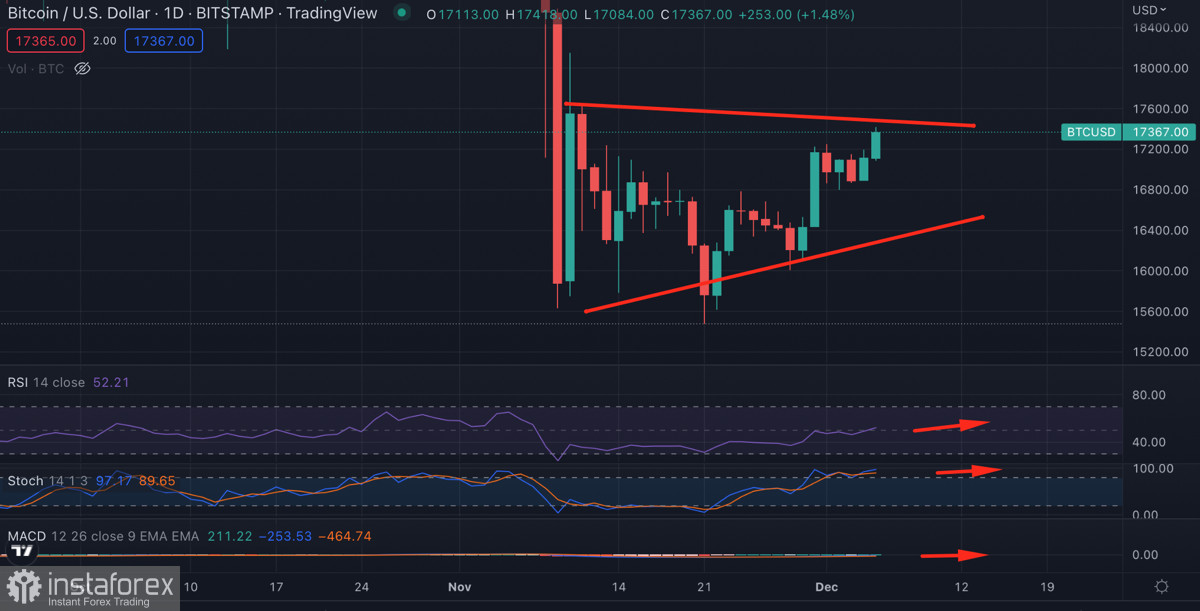
Bitcoin is in the final stages of breaking out of the $15.6k–$17.5k triangle. Having reached a local bottom on November 21, bullish activity followed, thanks to which Bitcoin maintains an upward direction for the third week in a row.

The asset is gradually approaching the monthly high, which is a strong resistance area. The cryptocurrency reached the $17,350 level, where it faced increased selling pressure. Up to $18.1k, Bitcoin will face increasing sales volumes.

This image is no longer relevant

This could provoke a local price pullback, and in order to maintain the upward potential of BTC, it is necessary to hold the $16.7k-$16.9k level . Otherwise, sellers will take advantage and send the price to retest $16.3k.

Technical metrics point to the continuation of bullish sentiment and the continuation of the upward movement of BTC/USD. The RSI remains bullish, but the stochastic oscillator has reached the overbought zone, which may indicate the need for a local pause.

This image is no longer relevant

The MACD indicator continues its upward movement towards the zero mark and approaches the green zone. This suggests that a possible bullish peak is yet to come. Given a certain overbought stochastic, we should expect a local price decline before continuing the upward movement.

Results

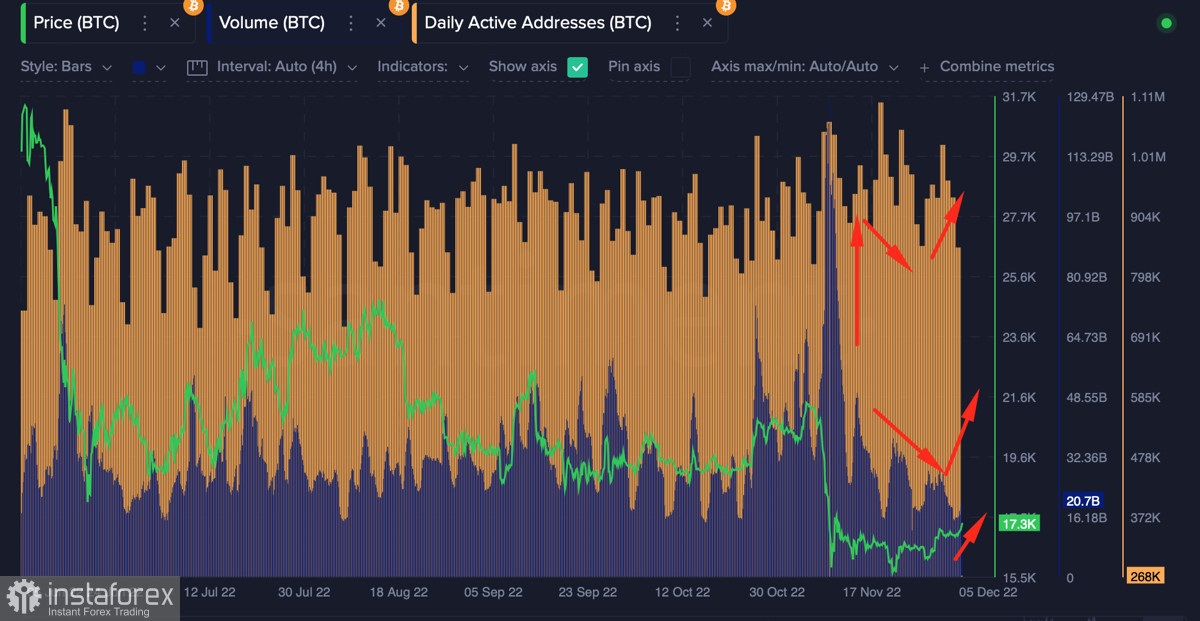
Technically, investors continue to actively buy the $15.5k bottom. In the coming days, it is important to monitor the dynamics of on-chain indicators of trading volumes and active addresses. If the indicators grow commensurately with the price increase, then this will be a signal of the strengthening of the bullish trend.

This image is no longer relevant

At the same time, it is important to understand that the fundamental background can play both for and against the upward movement. The market is sensitive to any macroeconomic events, as well as fluctuations in the stock market. Therefore, it is important to take into account the combination of technical and fundamental factors when actively trading BTC/USD.

Artem Petrenko,
الخبير التحليلي لدى شركة إنستافوركس
© 2007-2023
EURUSD
Euro vs US Dollar
Select timeframe
5
min
15
min
30
min
1
hour
4
hours
1
day
1
week
Start trade
Start trade
Earn on cryptocurrency rate changes with InstaForex
Download MetaTrader 4 and open your first trade
  • Grand Choice
    Contest by
    InstaForex
    InstaForex always strives to help you
    fulfill your biggest dreams.
    انضم إلى المسابقة
  • إيداع الحظ
    قم بإيداع 3,000 دولار في حسابك واحصل على $5,000 وأكثر من ذالك!
    في مارس نحن نقدم باليانصيب $5,000 ضمن حملة إيداع الحظ!
    احصل على فرصة للفوز من خلال إيداع 3,000 دولار في حساب تداول. بعد أن استوفيت هذا الشرط، تصبح مشاركًا في الحملة.
    انضم إلى المسابقة
  • تداول بحكمة، اربح جهازا
    قم بتعبئة حسابك بمبلغ لا يقل عن 500 دولار ، واشترك في المسابقة ، واحصل على فرصة للفوز بأجهزة الجوال.
    انضم إلى المسابقة
  • بونص 100٪
    فرصتك الفريدة للحصول على بونص 100٪ على إيداعك
    احصل على بونص
  • بونص 55٪
    تقدم بطلب للحصول على بونص 55٪ على كل إيداع
    احصل على بونص
  • بونص 30٪
    احصل على بونص 30٪ في كل مرة تقوم فيها بتعبئة حسابك
    احصل على بونص

Recommended Stories

تحديث البيتكوين ليوم 29 يوليو 2022: احتمالية استمرار الاتجاه الصعودي

التحليل الفني: يتداول زوج البيتكوين مقابل الدولار في الاتجاه الصعودي وهناك اختراق لنمط المثلث هذا الصباح لاستمرار الاتجاه الصعودي المحتمل. توصية التداول: نظرًا لاختراق نطاق التماسك اليوم ، أرى احتمالًا

Petar Jacimovic 18:24 2022-07-29 UTC+2

بيتكوين في الطريق للمستوى الجوهري 24،280 كما هو متوقع

وسع زوج البيتكوين مقابل الدولار نموه بعد محاولة إعادة اختبار مستويات المقاومة المكسورة. كنت تعلم من تحليلي السابق أن سعر البيتكوين يمكن أن يرتفع نحو 24280. فقد ارتفع بنسبة 16.50٪

Ralph Shedler 23:39 2022-07-28 UTC+2

يعيد الايثريوم اختبار المقاومة الأفقية المهمة.

يتداول الايثريوم بالقرب من المقاومة الأفقية الرئيسية قصيرة الأجل عند 1،680 دولارًا. اختبرت الايثريوم هذه المقاومة عدة مرات بالفعل لكنها فشلت من قبل. قد يكون الرفض الآخر لهذه المقاومة بمثابة

Alexandros Yfantis 22:05 2022-07-28 UTC+2

خطة التداول للبيتكوين ليوم 28 يوليو 2022.

ارتفعت عملة البيتكوين عبر 23400-500 دولار بعد اجتماع اللجنة الفيدرالية للسوق المفتوحة يوم الأربعاء. صنعت العملة المشفرة ارتفاعًا خلال اليوم عند حوالي 23،450 دولارًا يوم الخميس ، وهو ما يتماشى

Oscar Ton 14:36 2022-07-28 UTC+2

تحديث البيتكوين ليوم 28 يوليو 2022: احتمالية استمرار الاتجاه الصعودي

التحليل الفني: كان البيتكوين يتداول في الاتجاه الصعودي. هناك احتمالية لاستمرار الاتجاه الصعودي بعد التراجع توصية التداول: نظرًا للزخم الصعودي القوي من يوم أمس ، ترقب فرص الشراء عند التراجع

Petar Jacimovic 14:28 2022-07-28 UTC+2

لا يزال الريبل مقابل الدولار تحت الضغط لأن المضاربين على الارتفاع ليسوا أقوياء بما يكفي.

يتداول زوج الريبل مقابل الدولار حول 0.33 دولار حيث لم يحرز السعر أي تقدم حقيقي خلال الشهرين الماضيين. يتحرك السعر في الغالب بشكل جانبي داخل نطاق تداول بين 0.38 دولار

Alexandros Yfantis 23:27 2022-07-27 UTC+2

تحديث البيتكوين ليوم 27 يوليو 2022: احتمالية اختراق القناة الهابطة

التحليل الفني: يتداول البيتكوين في الاتجاه الصعودي وهناك احتمالية لاختراق القناة الهابطة. توصية التداول: نظرًا لاحتمال استمرار الاتجاه الصعودي للنمو ، أرى احتمالًا للارتفاع. راقب فرص الشراء المحتملة عند التراجعات

Petar Jacimovic 23:20 2022-07-27 UTC+2

خطة التداول للبيتكوين ليوم 27 يوليو 2022.

انخفض البيتكوين نحو 20700 دولار يوم الثلاثاء قبل أن يجد الدعم ويتراجع للأعلى. يُنظر إلى العملة المشفرة على أنها تتداول بالقرب من 21300 دولار في هذه المرحلة اثناء الكتابة

Oscar Ton 23:06 2022-07-27 UTC+2

خطة تداول البيتكوين ليوم 26 يوليو 2022.

تراجعت البيتكوين عبر أدنى مستوياتها عند 20700 دولار خلال اليوم الثلاثاء فقط لتجد بعض الدعم. العملة المشفرة آخذة في الارتداد ، ويُنظر إليها على أنها تتداول بالقرب من 20900 دولار

Oscar Ton 23:41 2022-07-26 UTC+2

تم رفض الايثريوم عند المقاومة 1.680 دولار.

يتداول الايثريوم حول 1،380 دولار بعد رفضه عند 1،680 دولار. استعاد السعر حتى الآن 23.6٪ من الانخفاض الكامل من 3.680 دولارًا ، وهذا تصحيح ضحل يشير إلى أن المضاربين

Alexandros Yfantis 16:04 2022-07-26 UTC+2
لا تستطيع التحدث الآن؟
اطرح سؤالك في الدردشة.