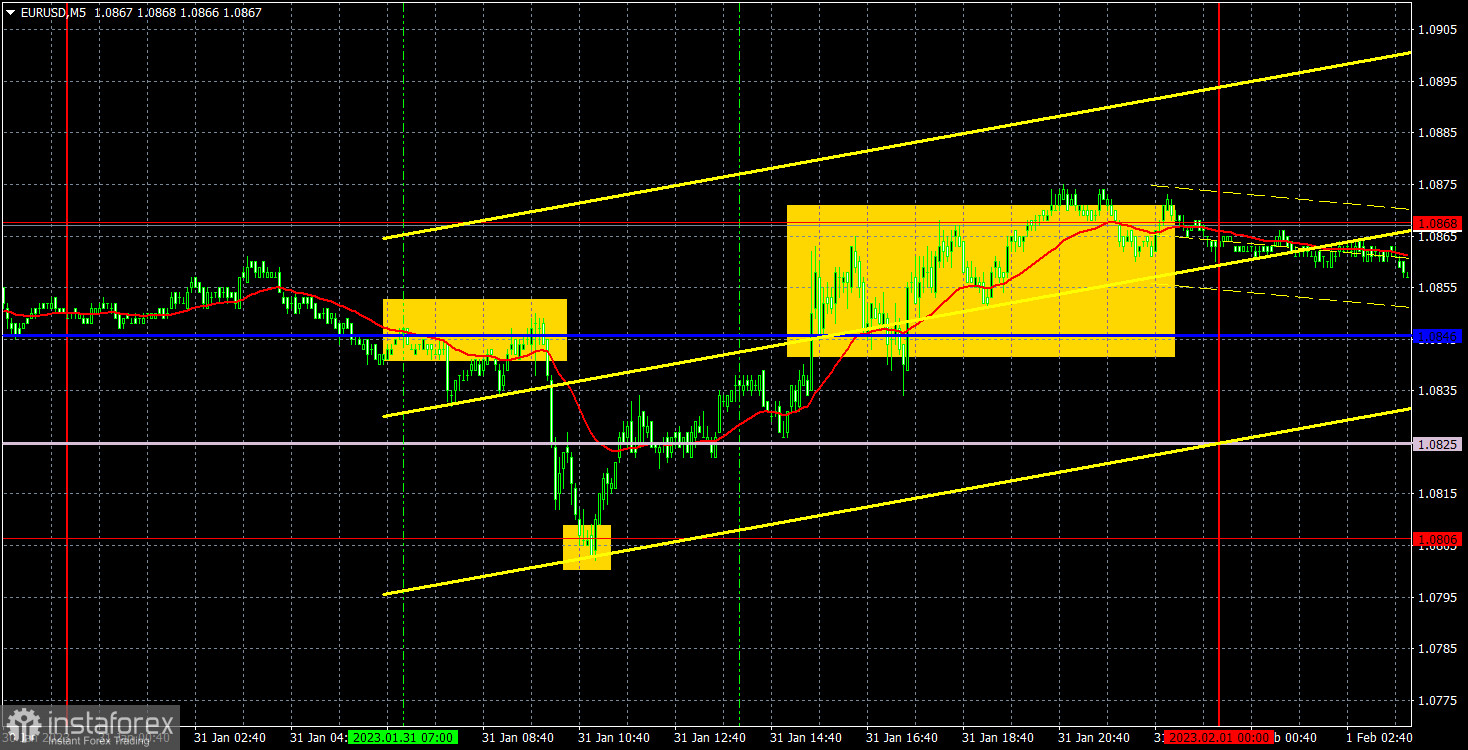
M5 chart of EUR/USD
EUR/USD did not show any interesting movements on Tuesday. The pair seesaws around the flat. In general, the pair's movements are unappealing, which is very difficult to work out. This week should be volatile and trendy, but as of Wednesday morning we haven't observed anything like that. Macroeconomic and fundamental backgrounds will start to appear this afternoon. Yesterday, the EU published its GDP report for the fourth quarter, which turned out to be unexpectedly positive and showed a 0.1% growth of the European economy instead of a contraction. As we can see, this report did not help the euro in any way and there was no reaction to it. So, all we can do is wait. At least we have to wait for today's US ISM index and the results of the Federal Reserve meeting in the evening.
Yesterday's trading signals were not good, but what else should we expect from the flat? In the beginning, the pair bounced from the critical line, and then it went down to 1.0806. This signal was manageable and it gained 20 pips. The rebound from 1.0806 was also a good buy signal, afterwards the pair returned to the Kijun-Sen line and spent the rest of the day in the 1.0846-1.0868 area. The profit was 20-30 pips. But the Senkou Span B line was located between the critical line and 1.0806, so the entire thing could be considered as one area. Consequently, we couldn't open any deals at all.
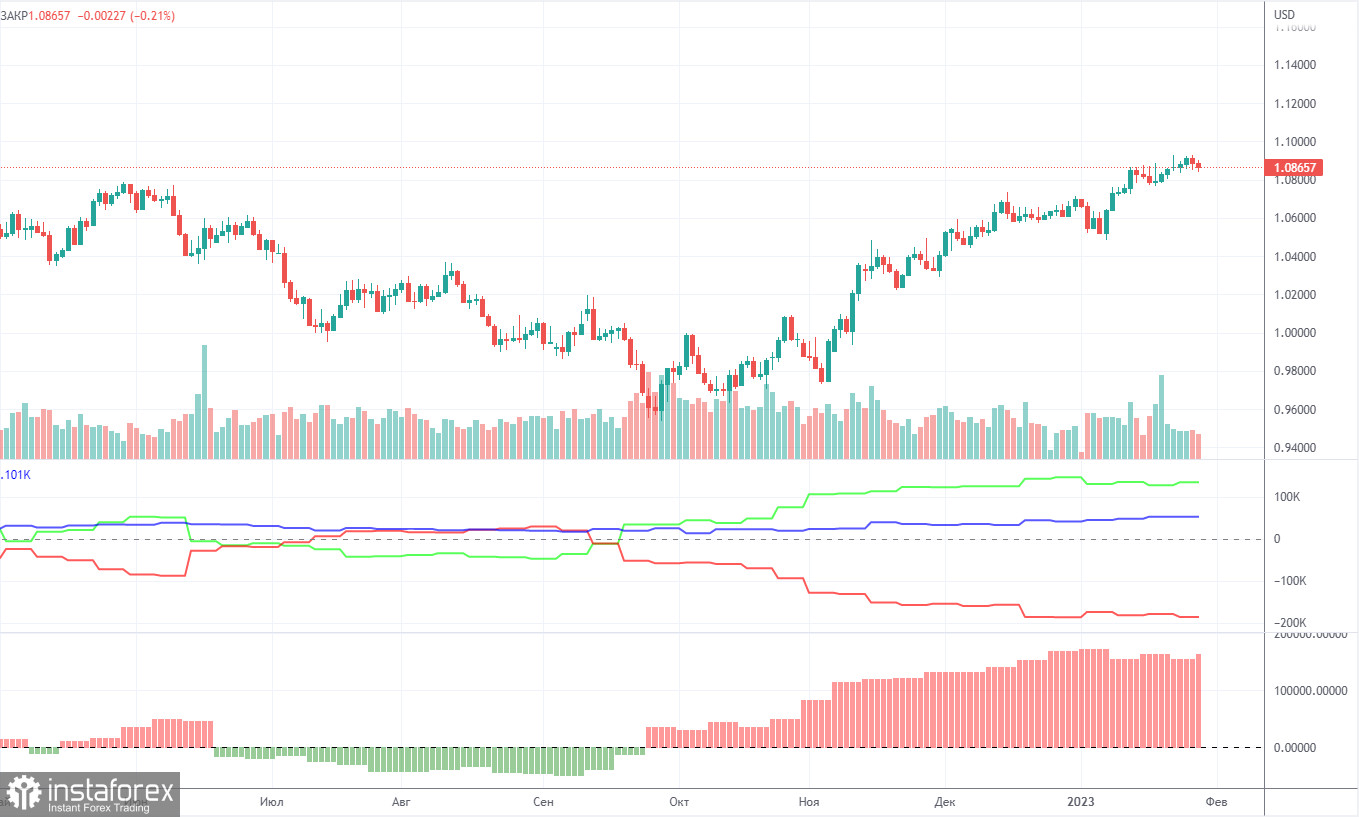
COT report
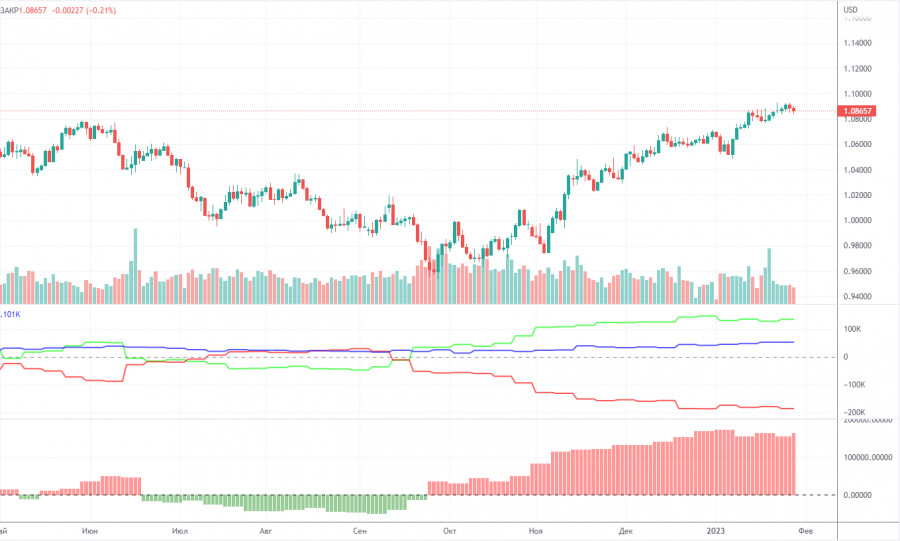
The COT reports for the euro in the last few months have been fully consistent with what is happening in the market. You can clearly see on the chart that the net position of big players (the second indicator) has been growing since early September. Around the same time, the euro started to grow. At this time, the net position of the non-commercial traders has been bullish and strengthens almost every week, but it is a rather high value that allows us to assume that the uptrend will end soon. Notably, the green and red lines of the first indicator have moved far apart from each other, which often precedes the end of the trend. During the given period, the number of long positions held by non-commercial traders decreased by 9,500, whereas the number of short positions fell by 2,000. Thus, the net positions decreased by 7,500. Now the number of long positions is higher than the number of short positions opened by non-commercial traders by 134,000. So now the question is: how long will the big players increase their longs? From a technical perspective, a bearish correction should have started a long time ago. In my opinion, this process can not continue for another 2 or 3 months. Even the net position indicator shows that we need to "unload" a bit, that is, to correct. The overall number of short orders exceeds the number of long orders by 52,000 (732,000 vs. 680,000).
H1 chart of EUR/USD
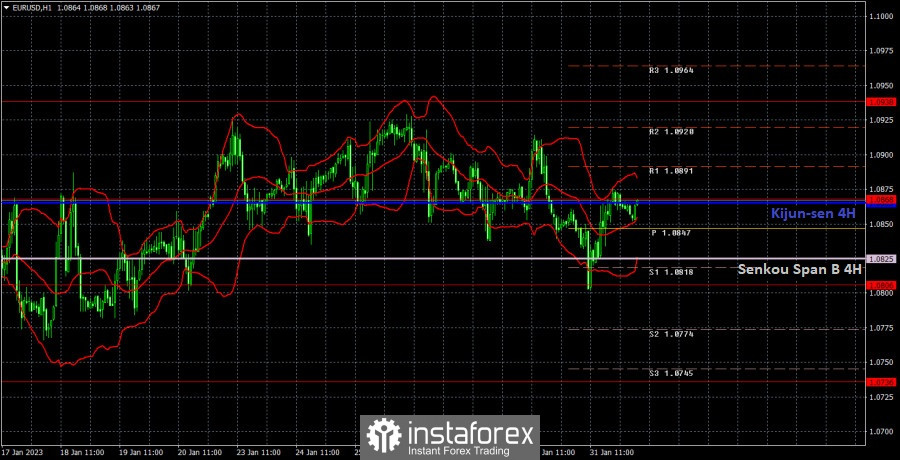
The technical picture on the one-hour chart remains unchanged. The pair is still moving sideways, and the Ichimoku indicator lines are starting to intersect more often. Volatility is weak. I expect more active movements in the second half of the week, but at the same time, let me remind you that volatility may increase, but that doesn't mean the pair would move in a trend. On Wednesday, the pair may trade at the following levels: 1.0658-1.0669, 1.0736, 1.0806, 1.0868, 1.0938, 1.1036, 1.1137, and also Senkou Span B (1.0825) and Kijun Sen (1.0866). Lines of the Ichimoku indicator may move during the day, which should be taken into account when determining trading signals. There are also support and resistance levels, but signals are not formed near these levels. Bounces and breakouts of the extreme levels and lines could act as signals. Don't forget about stop-loss orders, if the price covers 15 pips in the right direction. This will prevent you from losses in case of a false signal. On February 1, the EU will release reports on inflation, unemployment and the manufacturing PMI. In the U.S., we can look forward to the ISM index and the Federal Reserve meeting. There will be enough important events to keep the pair in one place.
What we see on the trading charts:
Price levels of support and resistance are thick red lines, near which the movement may end. They do not provide trading signals.
The Kijun-sen and Senkou Span B lines are the lines of the Ichimoku indicator, moved to the one-hour chart from the 4-hour one. They are strong lines.
Extreme levels are thin red lines from which the price bounced earlier. They provide trading signals.
Yellow lines are trend lines, trend channels, and any other technical patterns.
Indicator 1 on the COT charts reflects the net position size of each category of traders.
Indicator 2 on the COT charts reflects the net position size for the non-commercial group.