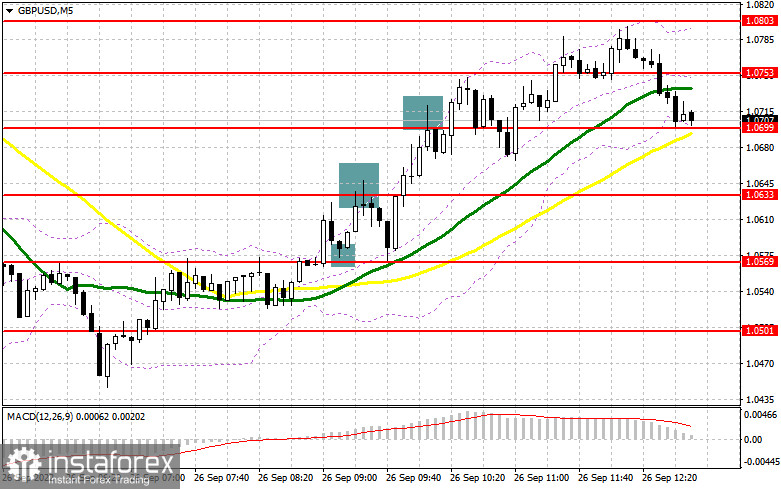
A robust sell-off in the morning was offset in full by active buyers' actions. In my morning article, I turned your attention to the level of 1.0569 and recommended making decisions on the market entry with this level on focus. Now let's take a look at the 5-minute chart and try to figure out what has actually happened. A breakout and the opposite test of 1.0569 generated a buy signal which triggered an immediate spike to 1.0633. The bears entered the market there which created a false breakout and a sell signal. In turn, this caused another sell-off and pushed the price down to 1.0569. At this level, we could again open long positions, but I didn't believe in such a significant recovery of GBP/USD and missed that signal. After another jump, a false breakout at 1.0699 created a sell signal, but the price declined just 25 pips. The technical picture is completely revised or the second half of the day.
What is needed to open long positions of GBP/USD
During the New York trade, GBP buyers will do everything possible to keep the balance which they created in the first half of the day. However, it will be hard to insist on this. Interviews of several Fed's policymakers are scheduled tonight. Investors are alert to comments from Raphael Bostic, Loretta Mester, and Susan Collins. They are likely to make hawkish remarks. This will push GBP/USD under pressure again. Earlier, the UK Chancellor of Exchequer suggested generous financial aid for the population despite the annual 10% inflation. In case GBP/USD comes under pressure again, the new task for the bulls will be to defend new support at around 1.0671 which was formed in the first half of the day. Only a false breakout there like I described above will provide a buy signal.
Once it happens, we could reckon a correction to 1.0738 from where I expect the sellers to enter the market. A breakout and the opposite test downward will be possible on condition of the dovish rhetoric by Fed's policymakers. So, the buyers will regain confidence and the door will be open towards 1.0793. The more distant target is seen at 1.0853 where I recommend setting a take profit. In case GBP/USD falls and the buyers lack activity at 1.0671, which is a more realistic scenario, the sellers will be regaining power. Therefore, it will activate stop losses and the sterling will tumble again. I would recommend opening long positions at about 1.0621 only on the condition of a false breakout. We could buy GBP/USD immediately at a dip from 1.0571 or lower from 1.0527 bearing in mind a 30-35-pips intraday correction.
What is needed to open short positions on GBP/USD
The bears totally lost control in the morning and now they have to push hard to regain dominance. I wouldn't be surprised if the buyers try to return to the nearest resistance at 1.0738 in the second half of the day. From there, GBP/USD could be sold on the assumption of a further decline. If it comes true, I expect a false breakout that will enable me to open short positions aiming to break 1.0671, the nearest support level. Only a breakout and the opposite test of this area upwards will create an extra sell signal, reckoning a drop to 1.0621 and 1.0572 where I recommend profit-taking. The lower target is seen at 1.9527. If GBP/USD grows and the bears lack activity at 1.0738, the bulls will grasp the opportunity to insist on their correction. In this case, I would advise you not to hurry up with selling GBP/USD. Only a false breakout at 1.0793 alongside hawkish remarks of Fed's speakers will provide a sell signal. We could sell the pair immediately at a rally from 1.0852 where moving averages are crossing or higher at 1.0906. We should bear in mind a 30-35-pips intraday downward correction.
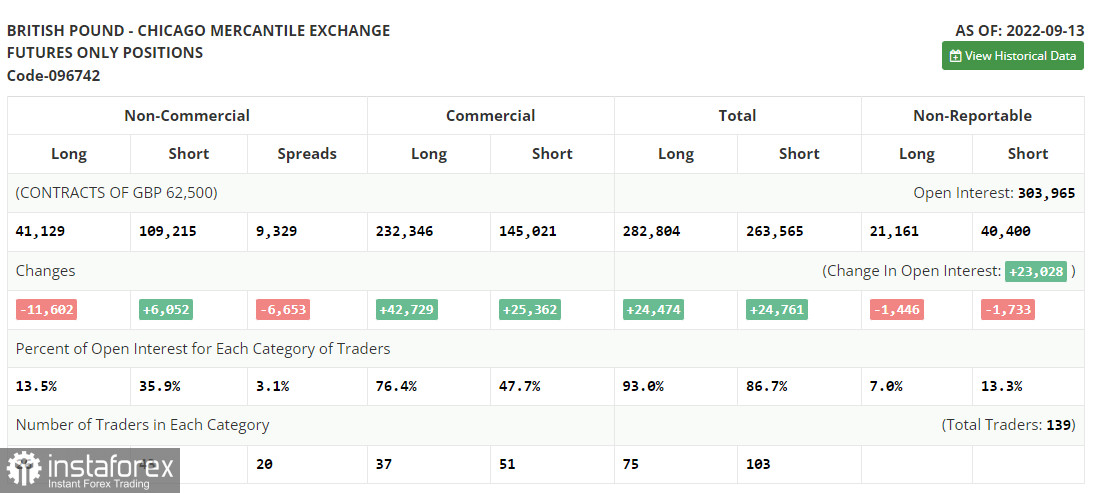
The COT (Commitment of Traders) report from September 13 logs an increase in short positions and a contraction in long ones. This confirms the fact of a large nosedive in GBP/USD. It is quite a challenge to exit this nosedive. Apart from the Fed's policy meeting, the Bank of England also announced its policy decision last week.
Another rate hike is sure to worsen economic conditions in the Kingdom which has been already slipping into a recession. The recent macroeconomic data highlights a slowdown in the UK economy. In the latest speech, Bank of England Governor Andrew Bailey reiterated the hawkish stance and the MPC's commitment to aggressive monetary tightening. On the one hand, higher interest rates should prop up the pound sterling. On the other hand, such measures prompt traders to sell the sterling on the back of a sharp slowdown in the national economic output and the cost-of-living crisis. No wonder, traders are betting on the strong US dollar as a safe haven asset. Tight financial conditions in the US also lure investors, thus boosting demand for the US dollar.
According to the COT report, long non-commercial positions fell by 11,602 to 41,129 whereas short non-commercial positions grew by 6,052 to 109,215. This increased the negative value of non-commercial net positions to -68,086 against -50,423. GBP/USD closed last week steeply lower at 1.1504 against 1.1526 a week ago.
Indicators' signals:
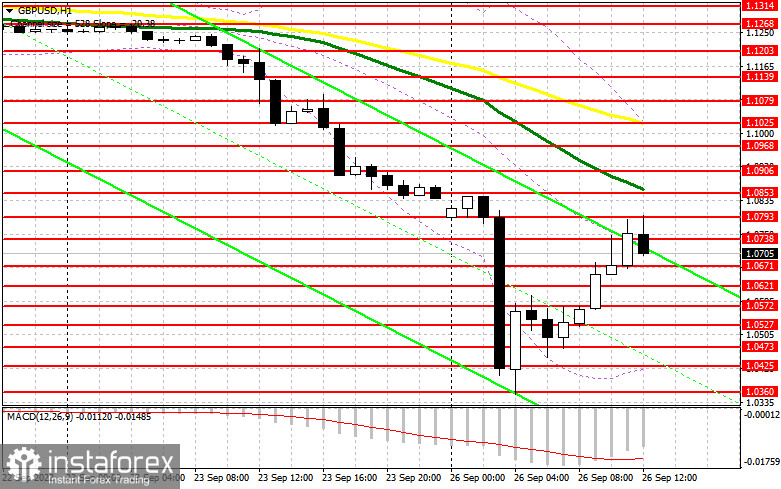
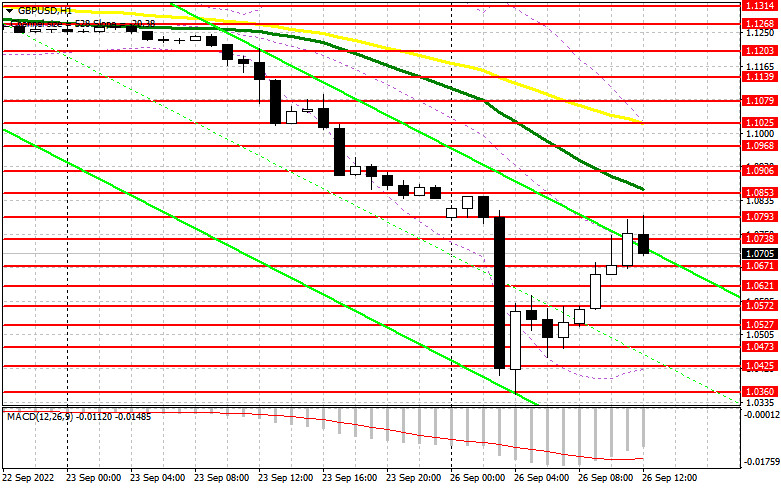
Trading is carried out below the 30 and 50 daily moving averages. It indicates a further decline in GBP/USD.
Moving averages
Note: The period and prices of moving averages are considered by the author on the H1 (1-hour) chart and differ from the general definition of the classic daily moving averages on the daily D1 chart.
Bollinger Bands
If GBP/USD grows, the indicator's upper border at 1.1025 will serve as resistance.
Description of indicators
- Moving average (moving average, determines the current trend by smoothing out volatility and noise). Period 50. It is marked yellow on the chart.
- Moving average (moving average, determines the current trend by smoothing out volatility and noise). Period 30. It is marked green on the chart.
- MACD indicator (Moving Average Convergence/Divergence — convergence/divergence of moving averages) Quick EMA period 12. Slow EMA period to 26. SMA period 9
- Bollinger Bands (Bollinger Bands). Period 20
- Non-commercial speculative traders, such as individual traders, hedge funds, and large institutions that use the futures market for speculative purposes and meet certain requirements.
- Long non-commercial positions represent the total long open position of non-commercial traders.
- Short non-commercial positions represent the total short open position of non-commercial traders.
- Total non-commercial net position is the difference between short and long positions of non-commercial traders.