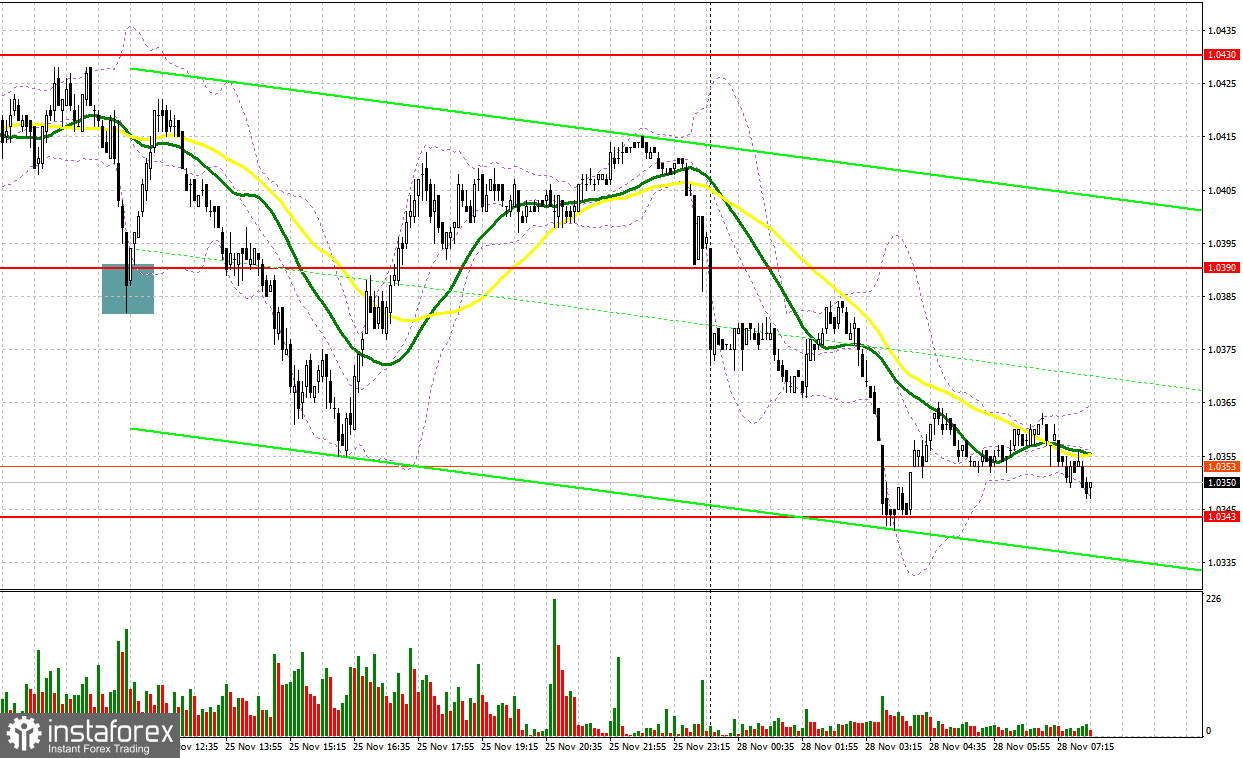
We received only one entry signal last Friday. Let's have a look at the 5-minute chart and see what happened there. In my morning review, I mentioned the level of 1.0430 and recommended entering the market from there. Due to slow trading, the pair failed to reach the above-mentioned level. Therefore, there were no entry signals in the first half of the day. In the afternoon, the pair formed a nice buy signal after the quote had declined to the level of 1.0390. As a result, the pair jumped by 35 pips but still failed to hit 1.0430.
For long positions on EUR/USD:
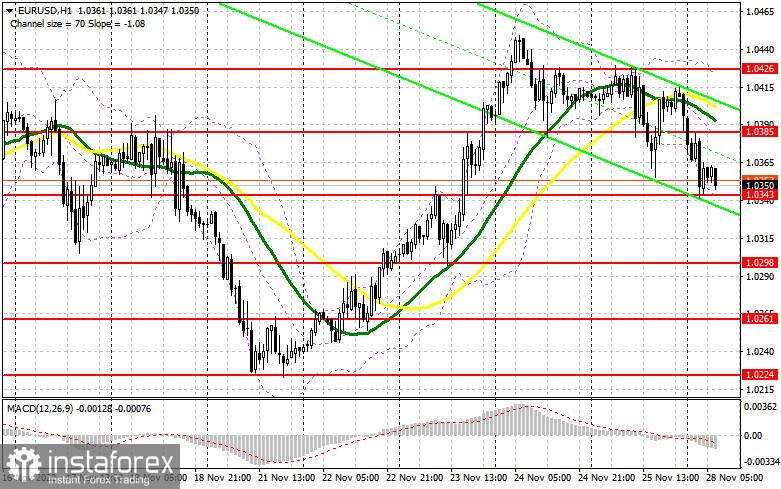
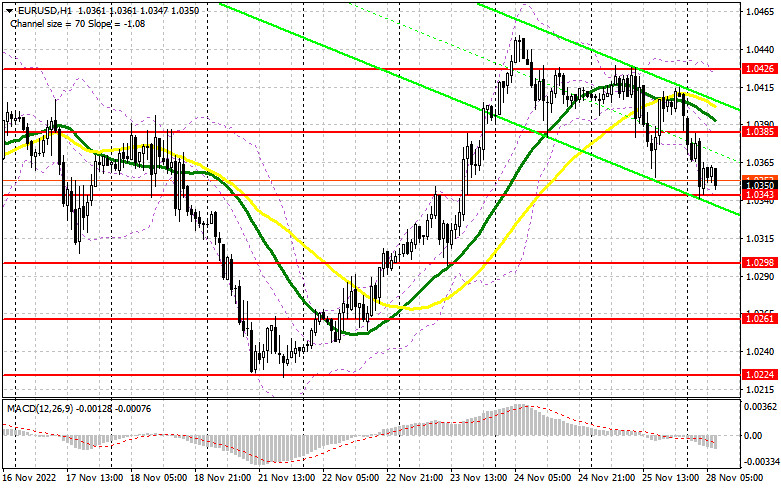
Positive GDP data from Germany in Q3 allowed the bulls to maintain control of the market. Yet, the Gfk Consumer Climate report which came in below expectations pushed the pair down by the end of the week. Today, there are no factors to pressure the pair. However, it is very possible that the price will form a strong downward correction at the end of the month after developing a steady uptrend throughout November. Today, top officials of the ECB, Elizabeth McCaul and Christine Lagarde, will give a speech. There were a lot of statements made last week so today's comments are unlikely to affect the market sentiment although they may support the pair. If the euro remains under pressure, it is advisable to focus on the nearest support at 1.0343. Its false breakout will help bulls finish the correction and will bring the pair back to 1.0385. The moving averages supporting the bears are located above this mark. In case of a breakout and a downward retest of this range, EUR/USD may surge towards 1.0426 and 1.0475. The highest target in this case will be the level of 1.0525. A breakout of this level will trigger stop-loss orders set by the sellers, thus creating another buy signal. This may bring the price higher to 1.0568 where I recommend profit taking. This move will confirm the bullish trend and restore the upside momentum. If EUR/USD declines and bulls are idle at 1.0343, the euro will come under more pressure but there is nothing to worry about. A breakout at 1.0343 will push the pair lower to 1.0298. You can buy the pair at this point only after a false breakout. It is possible to buy EUR/USD right after a rebound from 1.0261 or 1.0224, bearing in mind an upside correction of 30-35 pips within the day.
For short positions on EUR/USD:
Apparently, bears were taking advantage of a thin market due to a public holiday in the US. Today, you should pay attention to the resistance at 1.0385 as bears will need to close below this level in order to maintain control of the market. A false breakout at 1.0385 will create a good entry point and will push the euro back to the support at 1.0343. In the Asian session, the pair had bounced off this level so I wouldn't expect the price to rise near this mark. Consolidation below this range may put more pressure on the euro at the start of the week. If so, the pair may extend its downward correction. A breakout of 1.0343 and its upward retest will generate a sell signal, thus triggering stop-loss orders set by the bulls. This may result in a deeper decline to 1.0298 where the buyers may interfere in an attempt to continue the upturned. The downward target will be found at 1.0261 where I recommend profit taking. If EUR/USD advances in the European session and bears are idle at 1.0385, the demand for the pair will increase. In this case, trading will shift to the sideways channel where bulls will prevail. If so, the price may retest the level of 1.0426. In this scenario, I wouldn't recommend selling the pair. Going short will be possible only after a false breakout at 1.0426. You can sell EUR/USD right after a rebound from the highs of 1.0475 and 1.0525, or even higher - at 1.0568, keeping in mind a possible downward correction of 30–35 pips within the day.
COT report
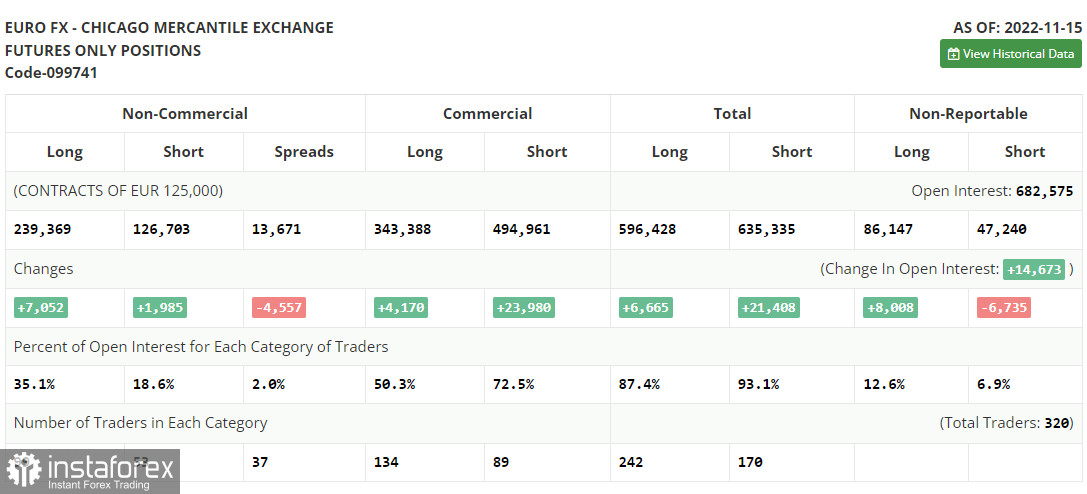
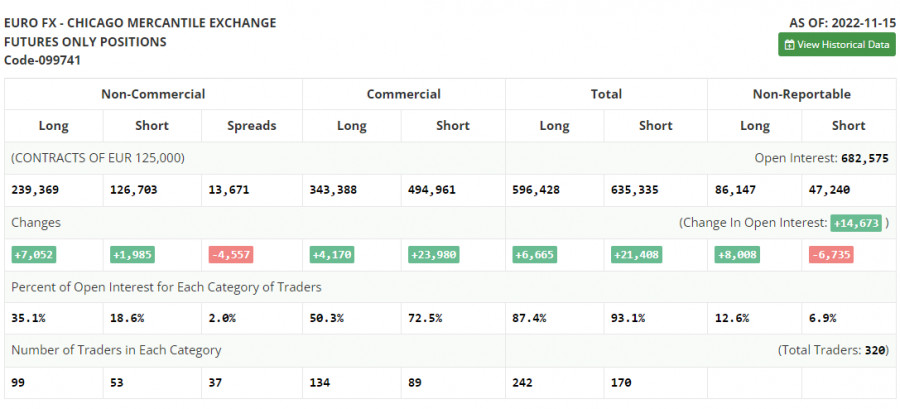
The Commitments of Traders report for November 15 showed a rise in both short and long positions. There have been speculations lately that the Fed may ease its current aggressive monetary policy starting this December. At the same time, these assumptions contrast with the recent US retail sales data revealing that the indicator increased in October. Moreover, the report has surpassed all forecasts, clearly indicating that inflationary pressures remain strong at the end of the year. Therefore, the recent CPI report from the US demonstrating a slowdown in prices should be taken with caution. Apparently, the US Federal Reserve will stick to its plan and will keep raising rates. As for the euro, the demand for risk assets has indeed increased. However, amid the recent GDP data in the eurozone, the euro/dollar pair is very unlikely to perform a strong upward movement until the end of the year. According to the COT report, long positions of the non-commercial group of traders increased by 7,052 to 239,369 while short positions rose by 1,985 to 126,703. The non-commercial net position remained positive and stood at 112,666 compared to 107,599 a week ago. This indicates that investors are taking advantage of a cheaper euro and continue to buy it even though it is holding above the parity level. They might also be accumulating long positions in hope that the pair will start to recover sooner or later. The weekly closing price advanced to 1.0390 from 1.0104.
Indicator signals:
Moving Averages
Trading below the 30- and 50-day moving averages indicates that the euro is going through a correction.
Please note that the time period and levels of the moving averages are analyzed only for the H1 chart, which differs from the general definition of the classic daily moving averages on the D1 chart.
Bollinger Bands
If the pair advances, the upper band of the indicator at 1.0426 will act as resistance. In case of a decline, the lower band of the indicator at 1.0340 will serve as support.
Description of indicators:
• A moving average of a 50-day period determines the current trend by smoothing volatility and noise; marked in yellow on the chart;
• A moving average of a 30-day period determines the current trend by smoothing volatility and noise; marked in green on the chart;
• MACD Indicator (Moving Average Convergence/Divergence) Fast EMA with a 12-day period; Slow EMA with a 26-day period. SMA with a 9-day period;
• Bollinger Bands: 20-day period;
• Non-commercial traders are speculators such as individual traders, hedge funds, and large institutions who use the futures market for speculative purposes and meet certain requirements;
• Long non-commercial positions represent the total number of long positions opened by non-commercial traders;
• Short non-commercial positions represent the total number of short positions opened by non-commercial traders;
• The non-commercial net position is the difference between short and long positions of non-commercial traders.