Here are the details of the economic calendar for October 22:
The UK's retail sales data were published last Friday, which turned out to be terrible. Nothing good was expected from retail sales, whose level of zero growth should have been replaced by a decline of 0.4%. But as a result, a decline of 1.3% was recorded in annual and monthly terms, which declined by 0.2%, instead of an increase of 0.5%.
- The pound sterling was in shock, and only preliminary data on business activity slightly smoothed out the depressing situation.
- The index of business activity in the UK services sector rose from 55.4 points to 58.0 points, with a forecast decline to 54.5 points.
- The index of business activity in the UK manufacturing sector rose from 57.1 points to 57.7 points, with a forecast decline to 55.8 points.
- The composite index rose from 54.9 points to 56.8 points.
Like Americans, Europeans also reported their PMI data, where there was no such progress as in Britain.
The market did not react particularly strongly to the statistics.
Analysis of trading charts from October 22:
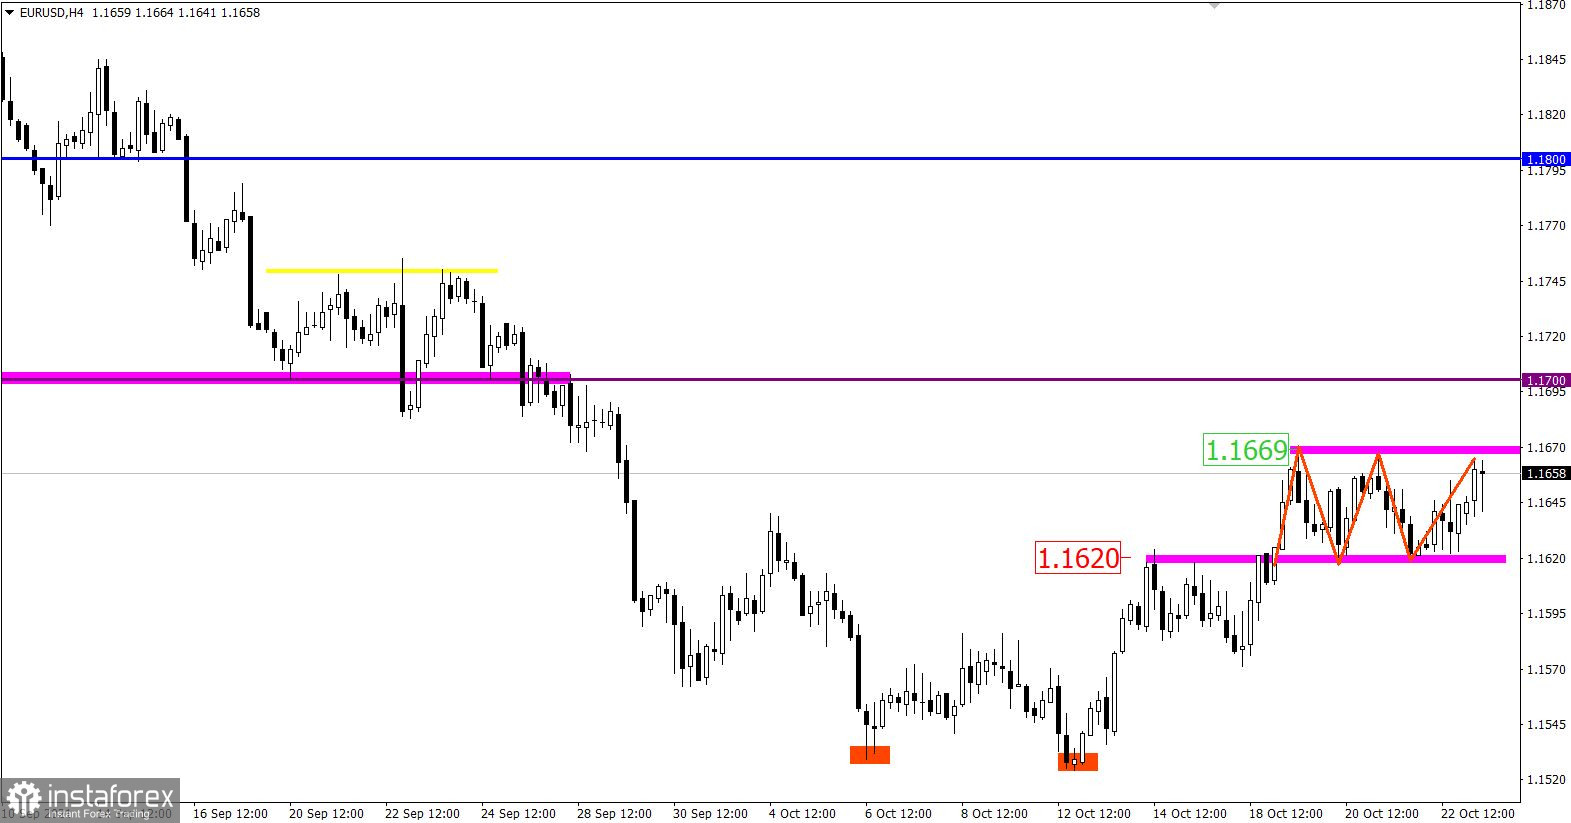
The EUR/USD pair met the resistance level of 1.1669 towards correction, relative to which there was a pullback after stagnation in the amplitude of 1.1620/1.1669.
This type of price fluctuation signals a slowdown in the correction and a transition to a side channel, which can lead to a new round of acceleration in the market.
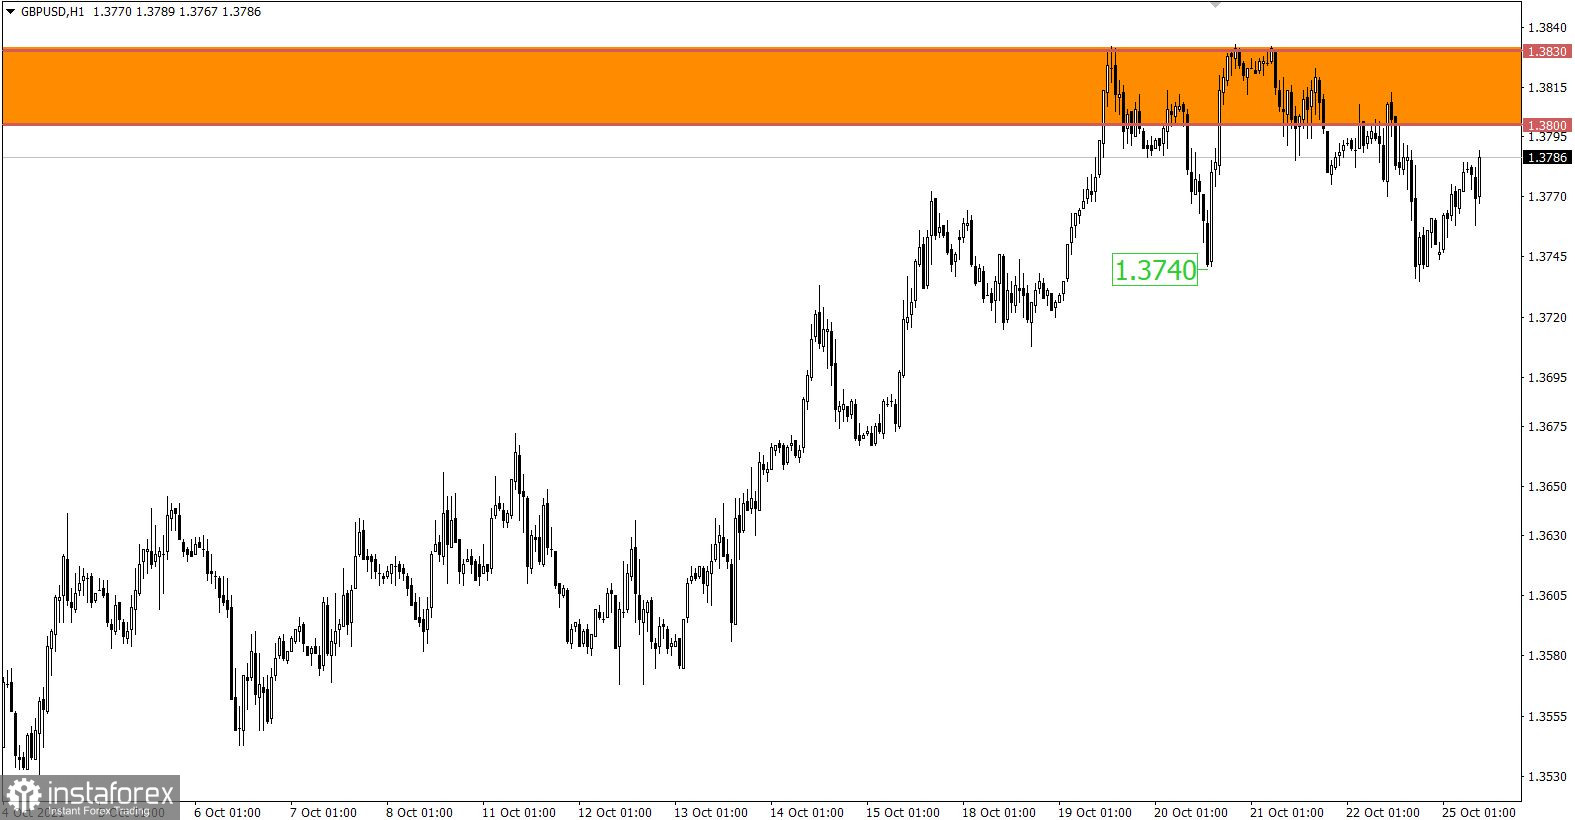
The GBP/USD pair rebounded from the resistance area of 1.3800/1.3830, returning the quote to the local low (1.3741) of October 20. In fact, sellers received the first signal of a possible change in trading interests.
* A change of trading interests is when there is a change of direction in the market from ascending to descending or from descending to ascending.
* The resistance level is the so-called price coordinate, from which the quote can slow down or stop the upward course. The principle of constructing this level is to reduce the price stop points on the history of the chart, where a price reversal in the market has already taken place.
October 25 economic calendar:
Monday is traditionally accompanied by an absolutely empty macroeconomic calendar. Therefore, special attention is paid to the information flow and technical analysis.
Trading plan for EUR/USD on October 25:
The 1.1620/1.1669 side channel is still relevant in the market, despite the rather long stage of its formation. It can be assumed that there is a process of accumulation of trading forces. As a result, this will lead to a natural acceleration in the market.
In this situation, the most appropriate trading tactic is considered to be the method of breaking one or another border of the established range.
Buy positions will be considered after the price has been held above the level of 1.1670.
Sell positions will be considered after the price has been held below the level of 1.1620.
Trading plan for GBP/USD on October 25:
It can be assumed that the quote will be squeezed between the level of 1.3740 and the level of 1.3800 for a while. This may have a positive effect on the volume of short positions. In turn, the sell signal will arrive when the price is kept below the level of 1.3720. This scenario will gradually weaken the pound.
What is reflected in the trading charts?
A candlestick chart view is graphical rectangles of white and black light, with sticks on top and bottom. When analyzing each candle in detail, you will see its characteristics of a relative period: the opening price, closing price, and maximum and minimum prices.
Horizontal levels are price coordinates, relative to which a stop or a price reversal may occur. These levels are called support and resistance in the market.
Circles and rectangles are highlighted examples where the price of the story unfolded. This color selection indicates horizontal lines that may put pressure on the quote in the future.
The up/down arrows are the reference points of the possible price direction in the future.