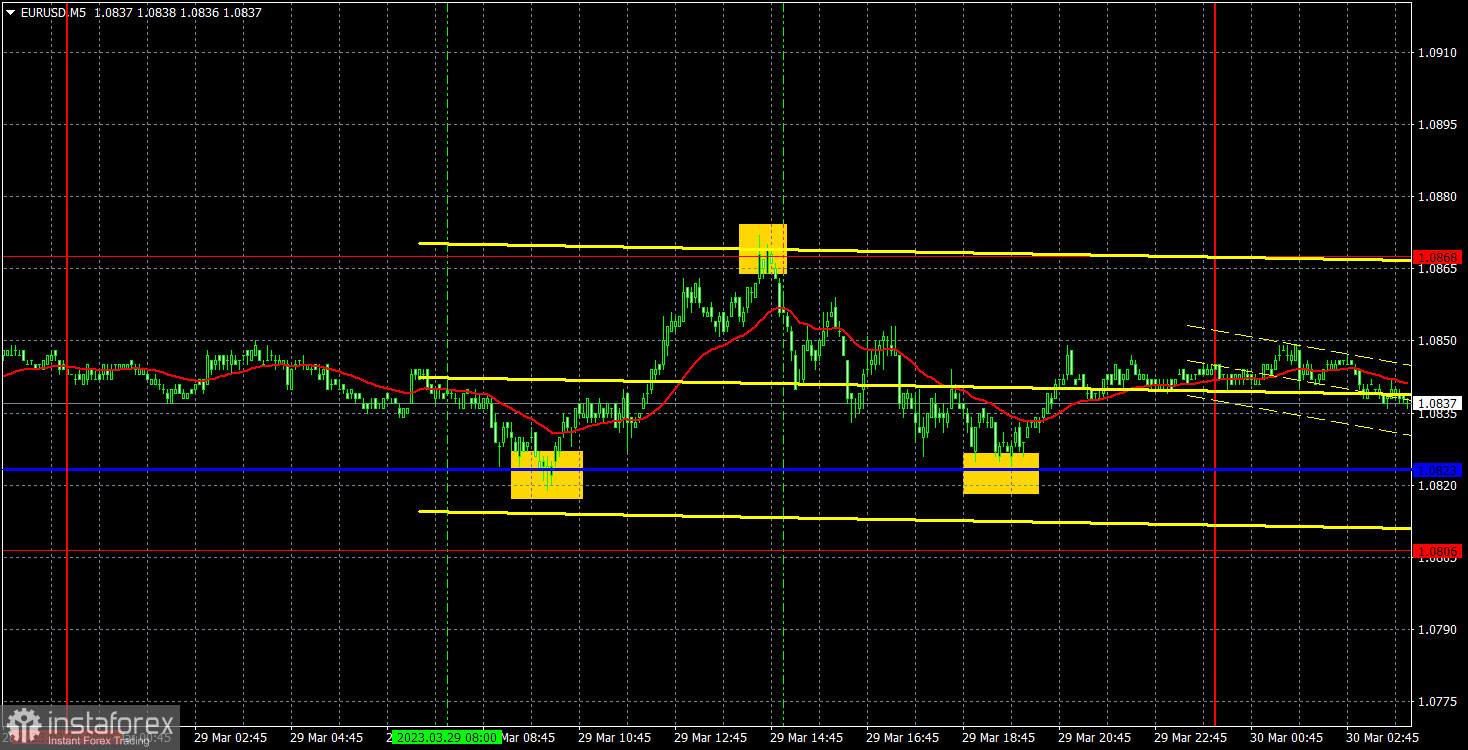
5M chart of EUR/USD
On Wednesday, EUR/USD stretched its weak upward movement. Although on the 5-minute chart, the entire movement looked like a flat. Nevertheless, the pair tried to stretch its upward movement amid low volatility and complete absence of any fundamental and macroeconomic background. It turned out badly. The new, rebuilt uptrend line is in close proximity to the price, which hints at a possible breakthrough in the near future. Therefore, we can get a new strong sell signal. The euro refuses to fall, though in my opinion, it would be the most logical course of events. Important news and reports are almost flat till the end of the week, so weak moves or a flat might persist.
Speaking of trading signals, traders got lucky yesterday. Despite the weak volatility and the flat, the pair perfectly reached important levels and lines, forming a good signal near each of them. First there was a rebound from the critical line, then from 1.0868, and then from the Kijun-sen again. The first two signals should have been used accurately, and each deal made about 20 pips. The last signal shouldn't have been used, as it was formed too late. 40 pips profit with 50 pips volatility is an excellent result.
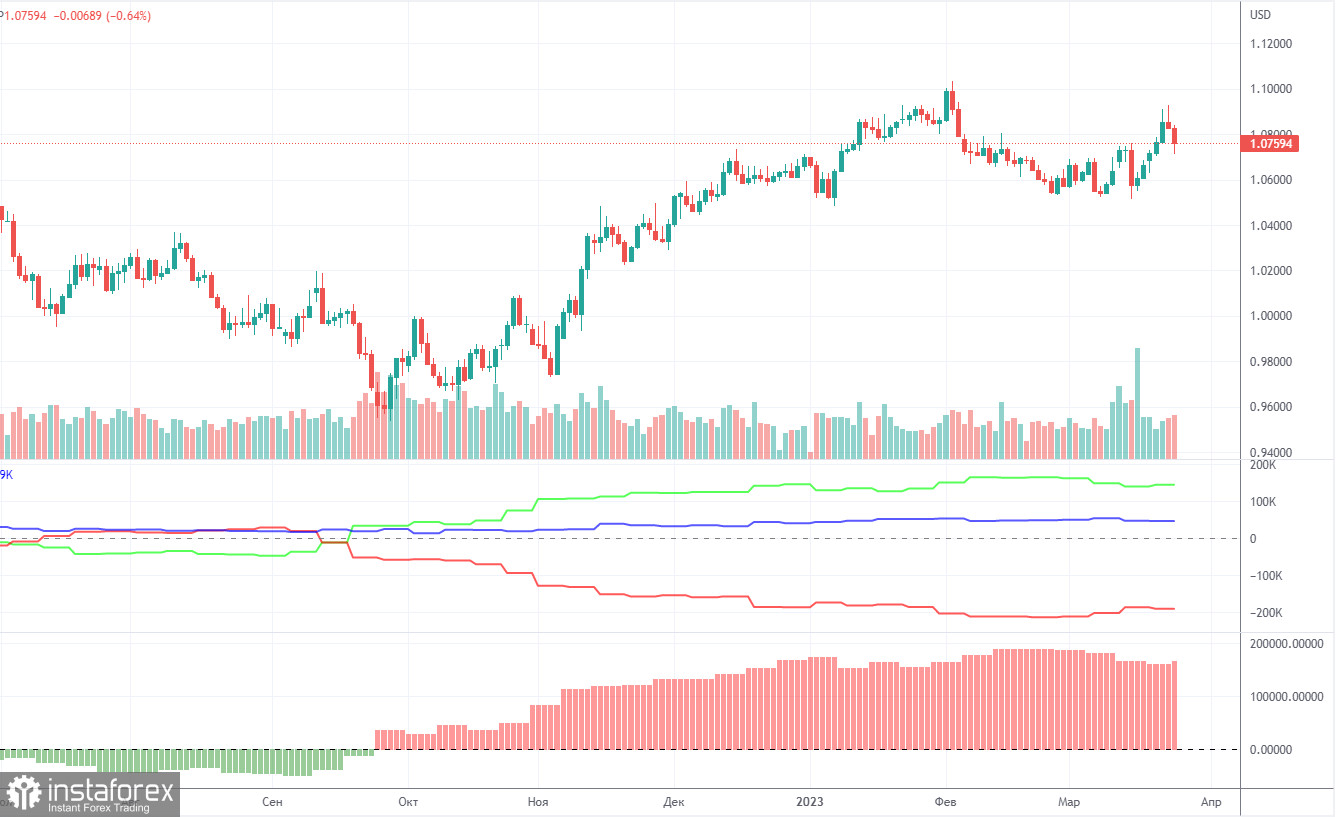
COT report:
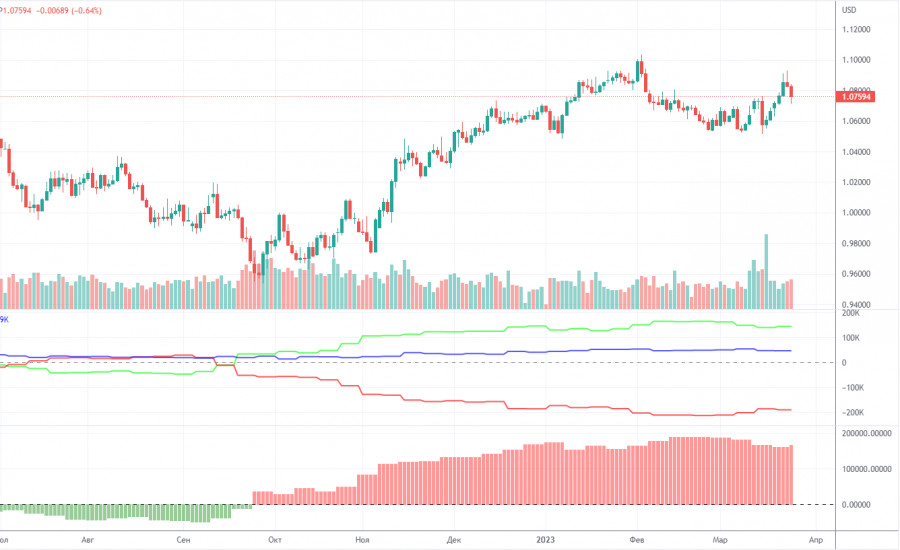
On Friday, the new COT report for March 21 was released. The Commodity Futures Trading Commission has caught up with the lost time and has now released reports exactly on time. In the last few months, the picture was completely consistent with what was happening in the market. On the chart above, we see that the net non-commercial position of large traders (second indicator) has risen since September 2022. At about the same time, the euro started to rise. The net non-commercial position is bullish and only started to fall during the last couple of weeks, which coincides with the euro's decline. I have already drawn your attention to the fact that a fairly high value of the "net position" allows us to expect the uptrend to stop shortly. Such a signal comes from the first indicator, with the green line and the red line being far apart, which is usually a sign of the end of a trend. The euro has already started to fall, but we don't know if it's just a bearish correction or a new downtrend. According to the latest report, non-commercial traders closed 6,500 long positions, while the number of short ones decreased by 11,300. Consequently, the net position rose by 4,800. The number of long positions exceeds that of short ones by 145,000. In any case, a correction has been looming for a long time. Therefore, even without reports, it is clear that the downtrend will continue.
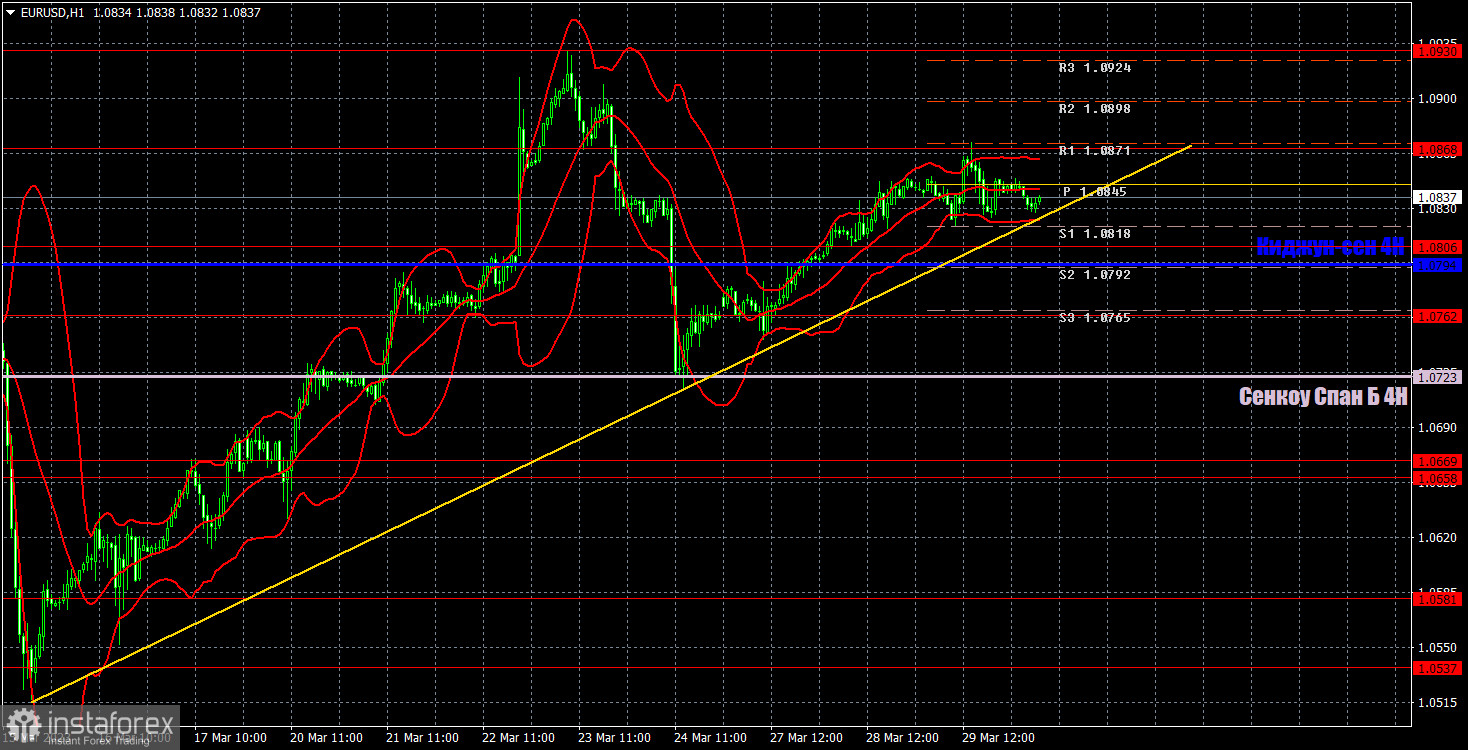
1H chart of EUR/USD
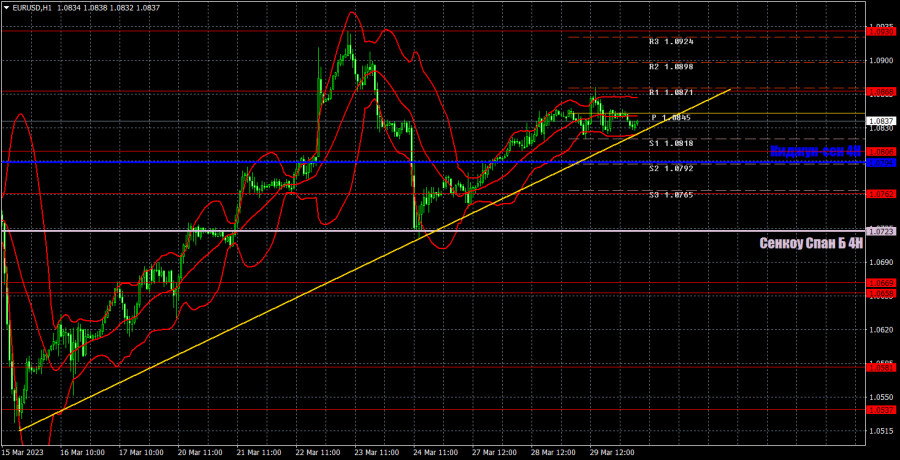
On the one-hour chart, EUR/USD has been rising again for no reason at all, and for the third straight day. The growth was not particularly impressive, but then again it's still growth. Even after crossing the previous trend line, the downward movement still did not start. Now the pair might try to consolidate below the new trend line and take the course towards the Senkou Span B line again. I still believe that the pair should start a sharp downward movement. On Thursday, important levels are seen at 1.0537, 1.0581, 1.0658-1.0669, 1.0762, 1.0806, 1.0868, 1.0938, 1.1033, 1.1137-1.1185, and also Senkou Span B lines (1.0723) and Kijun Sen (1.0794) lines. Ichimoku indicator lines can move intraday, which should be taken into account when determining trading signals. There are also support and resistance although no signals are made near these levels. They could be made when the price either breaks or rebounds from these extreme levels. Do not forget to place Stop Loss at the breakeven point when the price goes by 15 pips in the right direction. In case of a false breakout, it could save you from possible losses. On March 30, Germany will release its inflation report for March and the U.S. will release its final estimate of Q4 GDP. It's not exactly that important for traders, but since there was no data during the first three days of the week, maybe this time traders will react. This is especially true for the inflation report.
Indicators on charts:
Resistance/support - thick red lines, near which the trend may stop. They do not make trading signals.
Kijun-sen and Senkou Span B are the Ichimoku indicator lines moved to the hourly timeframe from the 4-hour timeframe. They are also strong lines.
Extreme levels are thin red lines, from which the price used to bounce earlier. They can produce trading signals.
Yellow lines are trend lines, trend channels, and any other technical patterns.
Indicator 1 on the COT chart is the size of the net position of each trader category.
Indicator 2 on the COT chart is the size of the net position for the Non-commercial group of traders.