empty
 
 
08.12.2022 11:51 AM
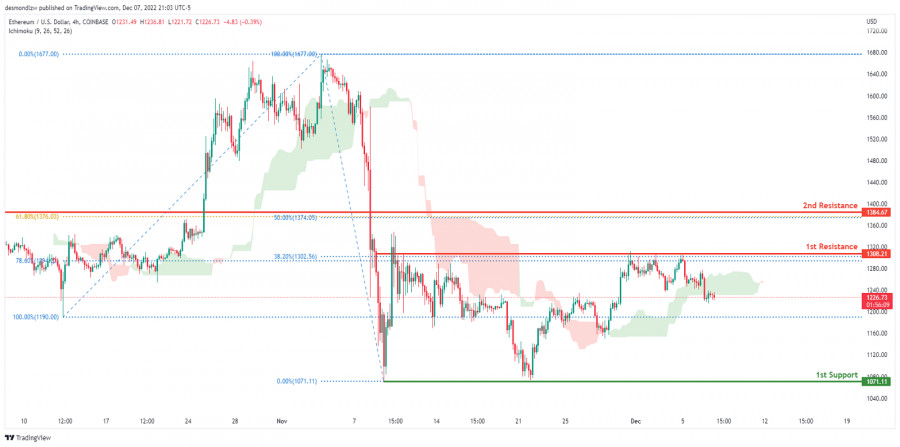
ETHUSD Potential For Bearish Drop | 8th December 2022

This image is no longer relevant

Looking at the H4 chart, my overall bias for ETHUSD is bearish due to the current price being below the Ichimoku cloud, indicating a bearish market. Expecting price to head back down towards the 1st support at 1071.11, where the previous swing low is. In an alternative scenario, price could possibly break the 1st resistance at 1308.21, where the 38.2% and 78.6% Fibonacci lines are before heading towards the 2nd resistance line at 1384.67, where the 50% and 61.8% Fibonacci lines are.

Trading Recommendation

Entry: 1308.21

Reason for Entry: 1st resistance line

Take Profit:1071.11

Reason for Take Profit: 1st support line

Stop Loss: 1677.00

Reason for Stop Loss:

Slightly above where the 2nd resistance line is located.

EURUSD
Euro vs US Dollar
Select timeframe
5
min
15
min
30
min
1
hour
4
hours
1
day
1
week
Start trade
Start trade
BTCUSD, H4 | Potential Reversal from a key level ?
The BTC/USD chart is currently bearish, indicating potential further price drops. The first resistance level at 28342 could prompt a bearish reaction towards the first support level at 26557. This support level is an overlap support with a 23.60% Fibonacci retracement, which could be a strong.
Author: Dean Leo
01:10 2023-03-24 UTC--4
1990
XAUUSD, H4 | Continue to 1st Support?
The XAU/USD chart currently has a bearish momentum, with potential for a bearish reaction off the first resistance level at 2007 and a drop towards the first support level at 1957. This support level has held prices up before and if broken, the price could drop towards the second support level at.
Author: Dean Leo
01:09 2023-03-24 UTC--4
2470
USDJPY, H4 | Strong descending trendline ?
The USD/JPY pair currently has a weak momentum with low confidence due to its position below a major descending trend line, indicating possible bearish momentum. Breaking off from the first support at 130.39 could lead to a potential drop to the second support level at 128.10, which is a.
Author: Dean Leo
01:07 2023-03-24 UTC--4
1630
Show more
  • Grand Choice
    Contest by
    InstaForex
    InstaForex always strives to help you
    fulfill your biggest dreams.
    THAM GIA CUỘC THI
  • Tiền gửi lần truy cập
    Ký quỹ tài khoản của bạn với $3000 và nhận được $8000 nhiều hơn!
    Trong Tháng 3 chúng tôi xổ $8000 trong chiến dịch Chancy Deposit!
    Có được một cơ hội giành chiến thắng bằng việc ký quỹ $3000 vào một tài khoản giao dịch. Đáp ứng được điều kiện này, bạn trở thành một người tham gia chiến dịch.
    THAM GIA CUỘC THI
  • Giao dịch khôn ngoan, thành công
    Nạp tiền vào tài khoản của bạn với ít nhất $ 500, đăng ký cuộc thi và có cơ hội giành được các thiết bị di động.
    THAM GIA CUỘC THI
  • 100% tiền thưởng
    Cơ hội duy nhất của bạn để nhận 100% tiền thưởng khi gửi tiền
    NHẬN THƯỞNG
  • 55% Tiền thưởng
    Đăng ký tiền thưởng 55% cho mỗi lần gửi tiền của bạn
    NHẬN THƯỞNG
  • 30% tiền thưởng
    Nhận 30% tiền thưởng mỗi khi bạn nạp tiền vào tài khoản của mình
    NHẬN THƯỞNG

Recommended Stories

March 24, 2023 : EUR/USD daily technical review and trading opportunities.

The price level of 1.0800 remained a significant resistance level to offer SELL opportunities until the current upside movement was expressed. The next target is located around 1.1000 where

Mohamed Samy 16:55 2023-03-24 UTC+2

March 24, 2023 : EUR/USD Intraday technical analysis and trading plan.

Price action around the key-level of (1.0550-1.0600) was quite bullish. That's why, further bullish continuation towards 1.0800 was demonstrated. Moreover, more bullish advancement towards the nearest supply zone around 1.1150-1.1200

Mohamed Samy 16:54 2023-03-24 UTC+2

March 24, 2023 : GBP/USD Intraday technical analysis and significant key-levels.

The GBPUSD bulls failed to record a new high above 1.2200. Instead, a descending high was established around the same price level. Bearish pullback pursued towards the price levels

Mohamed Samy 16:53 2023-03-24 UTC+2

GBP/USD: reversal pattern activated

The GBP/USD pair crashed in the short term as the Dollar Index rebounded. Yesterday, I talked about exhausted buyers and about a Rising Wedge pattern. The pair's trading at 1.2225

Ralph Shedler 16:48 2023-03-24 UTC+2

Trading Signal for USD/JPY for March 24 - 27, 2023: buy above 130.10 (3/8 Murray - rebound)

Early in the US session, the Japanese Yen is trading around 130.10 bouncing after reaching a low around 129.62, the level which coincides with 3/8 Murray (129.68). Japanese yen like

Dimitrios Zappas 15:14 2023-03-24 UTC+2

EUR/USD: technical analysis on March 24, 2023

Hello, dear traders! On Thursday, EUR/USD reversed to the downside and almost approached the lower line of the ascending trend corridor, which indicates a bullish bias. Consolidation below the corridor

Samir Klishi 11:25 2023-03-24 UTC+2

GBP/USD: technical analysis on March 24, 2023. BoE raises rates for 11th time

Hello, dear traders! On the 1-hour chart, GBP/USD bounced off 1.2342, reversed to the downside, and headed toward 1.2238 and the lower limit of the ascending corridor. This line illustrates

Samir Klishi 11:25 2023-03-24 UTC+2

Forex forecast 03/24/2023 GBP/USD, USD/CHF, USD/CAD and Bitcoin from Sebastian Seliga

Let's take a look at the technical picture of GBP/USD, USD/CHF, USD/CAD and Bitcoin

Sebastian Seliga 09:59 2023-03-24 UTC+2

Video market update for March 24, 2023

Potential for the rally on USD/JPY

Petar Jacimovic 09:35 2023-03-24 UTC+2

USD/JPY analysis for March 24, 2023 - Potential for the rally

Technical analysis: USD/JPY has been trading downside in the background but I found falling wedge pattern in creation and potential upside movement. Due to potential downside exhaustion and bull crosses

Petar Jacimovic 09:35 2023-03-24 UTC+2
Không thể nói chuyện ngay bây giờ?
Đặt câu hỏi của bạn trong phần trò chuyện.