empty
 
 
26.01.2023 03:56 PM
Trading Signal for GOLD (XAU/USD) for January 26 - 27, 2023: sell below $1,945 (21 SMA - top bullish channel)

This image is no longer relevant

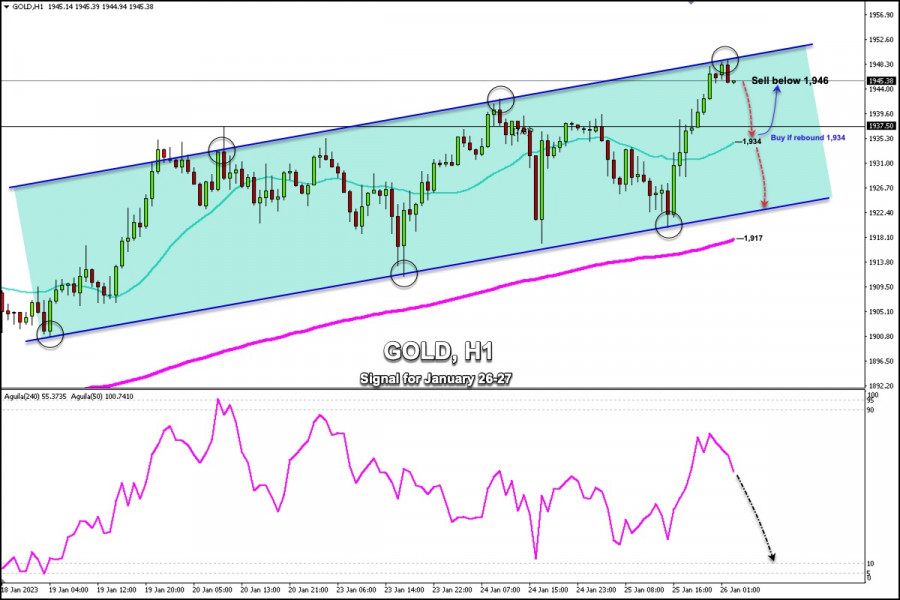
In the European session, XAU/USD reached 1,949.03, the highest level since April 2022. On the 1-hour chart, we can see that this level coincides with the top of the bullish channel formed since January 19.

In view of the fact that gold reached this resistance zone around the psychological level of 1,950, we could expect a technical correction in the next few hours and the price could even reach the 21 SMA located at 1,934. This zone has become a strong support for gold.

In case XAU/USD trades above 1,934 or above 7/8 Murray located at 1,937, the bullish cycle could resume and the metal could reach 1,945 and 1,956 (daily resistance).

The daily pivot point is around 1,938. We would expect that if gold consolidates below this level, the price will decline to reach support levels at 1,919 and 1,902.

The US dollar index (USDX) is showing signs of recovery which could put pressure on gold. However, this intraday rally will remain limited due to expectations of less aggressive monetary tightening by the Federal Reserve.

US yields are inversely correlated with gold. Looking at the chart, we see that these are unable to confirm a clear direction. Yields of 10-year benchmark Treasuries are hovering around 3.47% and the 2-year yield is around 4.11%. The lack of direction in yields contributed to XAU/USD trading in a range.

A firm consolidation above 1,938 should open the door to a bullish extension. In case gold continues trading above 1,950, it could hit the weekly resistance at 1,984 and ultimately at 8/8 Murray around the psychological level of $2,000. The corrections are limited, which suggests that the upside potential remains valid.

With a firm break below 1,935 (21 SMA), the next target will be in the 1,927 area. The next support is located at 1,923, coinciding with the bottom of the bullish channel. In case of a break of the bullish channel, we could expect the instrument to reach the 200 EMA located at 1,917. Finally, it could fall to the psychological level of 1,900.

Dimitrios Zappas,
Chuyên gia phân tích của InstaForex
© 2007-2023
EURUSD
Euro vs US Dollar
Select timeframe
5
min
15
min
30
min
1
hour
4
hours
1
day
1
week
Start trade
Start trade
  • Grand Choice
    Contest by
    InstaForex
    InstaForex always strives to help you
    fulfill your biggest dreams.
    THAM GIA CUỘC THI
  • Tiền gửi lần truy cập
    Ký quỹ tài khoản của bạn với $3000 và nhận được $8000 nhiều hơn!
    Trong Tháng 3 chúng tôi xổ $8000 trong chiến dịch Chancy Deposit!
    Có được một cơ hội giành chiến thắng bằng việc ký quỹ $3000 vào một tài khoản giao dịch. Đáp ứng được điều kiện này, bạn trở thành một người tham gia chiến dịch.
    THAM GIA CUỘC THI
  • Giao dịch khôn ngoan, thành công
    Nạp tiền vào tài khoản của bạn với ít nhất $ 500, đăng ký cuộc thi và có cơ hội giành được các thiết bị di động.
    THAM GIA CUỘC THI
  • 100% tiền thưởng
    Cơ hội duy nhất của bạn để nhận 100% tiền thưởng khi gửi tiền
    NHẬN THƯỞNG
  • 55% Tiền thưởng
    Đăng ký tiền thưởng 55% cho mỗi lần gửi tiền của bạn
    NHẬN THƯỞNG
  • 30% tiền thưởng
    Nhận 30% tiền thưởng mỗi khi bạn nạp tiền vào tài khoản của mình
    NHẬN THƯỞNG

Recommended Stories

Technical Analysis of GBP/USD for March 21, 2023

Technical Market Outlook: The GBP/USD pair has broken above the last swing high located at the level of 1.2202 ( now this level will act as the technical support

Sebastian Seliga 09:03 2023-03-21 UTC+2

Technical Analysis of EUR/USD for March 21, 2023

Technical Market Outlook: The EUR/USD pair keeps moving up towards the last swing high located at 1.0760 and the recent local high was made at the level of 1.0731

Sebastian Seliga 09:02 2023-03-21 UTC+2

Indicator analysis: Daily review of GBP/USD on March 21, 2023

The pound-dollar pair may move downward from the level of 1.2272 (closing of yesterday's daily candle) to test 1.2199, the 61.8% pullback level (blue dotted line). When testing this level

Stefan Doll 08:56 2023-03-21 UTC+2

Indicator analysis: Daily review of EUR/USD on March 21, 2023

The euro-dollar pair may move downward from the level of 1.0719 (closing of yesterday's daily candle) with the target of 1.0678, the 23.6% pullback level (yellow dotted line). After that

Stefan Doll 08:46 2023-03-21 UTC+2

EUR/USD analysis for March 21, 2023 - Potential for the breakout of the full flag pattern

Technical analysis: EUR/USD has been trading in the sideways range at the price of 1.0715 but in the upside trending condiiton, which is a sign for potential upside continuation

Petar Jacimovic 08:37 2023-03-21 UTC+2

Analysis of Gold for March 21,.2023 - Potential for the upside continuation

Technical analysis: Gold has been trading in the sideways range at the price of $1.975 but in the upside trending condiiton, which is a sign for potential upside continuation

Petar Jacimovic 08:28 2023-03-21 UTC+2

GBPUSD, H4 | Potential Bearish Reversal from key resistance?

The momentum of the GBP/USD chart is bearish, indicating a possible drop from the 1st resistance level towards the 1st support level. The 1st support level at 1.2194

Dean Leo 07:55 2023-03-21 UTC+2

USDJPY | PBullish Reversal?

Bullish momentum is currently observed on the USD/JPY chart, with the potential for price to rebound from the 1st support level and make its way towards the 1st resistance level

Dean Leo 07:54 2023-03-21 UTC+2

Forecast for EUR/USD on March 21, 2023

Yesterday, the euro was up 53 points, having overcome not only the balance indicator line on the daily chart, but it had also gotten through the collapse of the eurozone

Laurie Bailey 03:58 2023-03-21 UTC+2

Forecast for GBP/USD on March 21, 2023

The British pound gained 96 pips yesterday, reaching and stopping at the MACD daily line. If investors focus on tomorrow's Federal Reserve meeting, at which the rate is expected

Laurie Bailey 03:58 2023-03-21 UTC+2
Không thể nói chuyện ngay bây giờ?
Đặt câu hỏi của bạn trong phần trò chuyện.