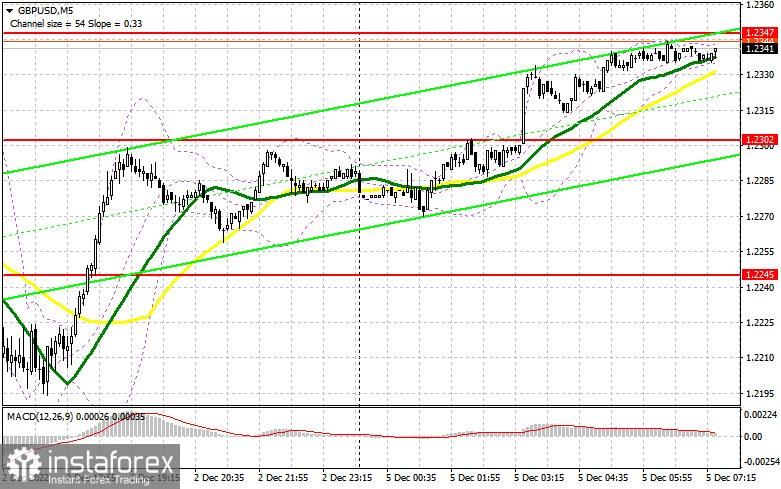
On Friday, the currency pair formed the only signal for market entry. Now let's look at the 5-minute chart and try to figure out what actually happened. In the previous article, I turned your attention to the level of 1.2245 and recommended taking decisions with this level in focus. A breakout and the opposite test of this area created an excellent market entry point with long positions following the upward bias. As a result, GBP jumped by more than 50 pips. In the second half of the day, even despite high volatility following US nonfarm payrolls, GBP/USD didn't provide a good market entry point.
What is needed to open long positions on GBP/USD
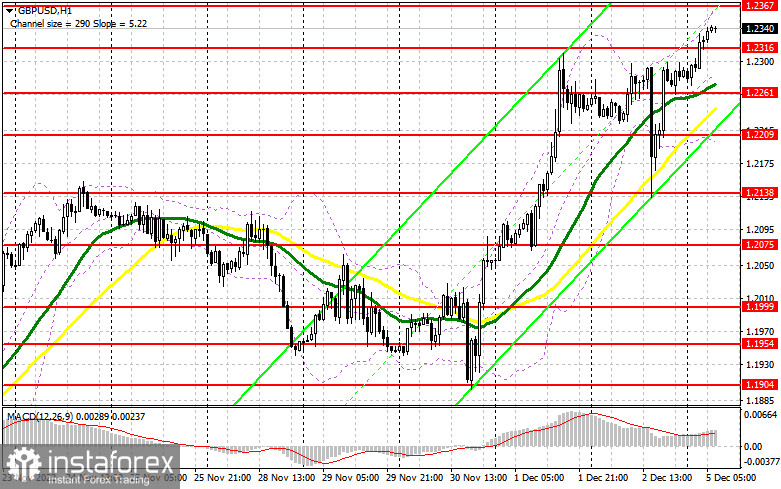
The strong US labor market didn't allow the US dollar to assert strength for long. Therefore, GBP/USD surged at the end of the last week. Today traders are keeping on buying GBP/USD in the Asian trade which proves robust demand for risky assets. The only obstacle to buying GBP/USD in the first half of the day will be the UK services PMI and the composite PMI. Both indicators are likely to be downbeat which will cap the upward potential of the sterling. It might come under pressure. In my viewpoint, it will be enough to convince new buyers to enter the market as it happened during the correction on Friday. For this reason, I consider 1.2316 to provide an efficient buy signal. Its false breakout will push the price to 1.2367 by the beginning of the American session. A breakout and consolidation above 1.2367 is the prime task for the buyers today. Indeed, once this level is taken out, we could expect a further bullish trend. The test of 1.2367 downwards could help the buyers to insist on the uptrend which opens the way to 1.2410, a new peak of December.
If the price climbed above, it will reinforce the uptrend with the prospects of breaking through 1.2450. If the bulls fail to fulfil this task and miss 1.2316, this will not destroy the overall uptrend, even though the pair might come under selling pressure for a while. In this case, I would warn you against hasty decisions. It would be better to buy GBP/USD during a decline at a false breakout at about 1.2261 where moving averages are benefitting the bulls. I would recommend opening long positions immediately at a drop from 1.2209, bearing in mind a 30-35-pips intraday correction.
What is needed to open short positions on GBP/USD
The sellers have a slim chance of a correction in the first half of the day. I don't think the market will develop in the bears' favor. Even very weak data on business activity in the UK service sector will exert brief pressure on the currency pair. Any large downward move in GBP/USD will be used to go long, betting on a further bullish trend. The best the sellers can do in the first half of the day is to defend 1.2367. A false breakout of this level will be a good sell signal with a view to the price falling towards the nearest support at 1.2316 where moving averages are benefiting the buyers. The lowest target is seen at 1.2209 where I recommend profit-taking.
In case GBP/USD grows and the bears are inactive at 1.2367, the market is likely to remain in the bulls' grips. Only a false breakout at about 1.2410 (a local high) will generate a market entry point for short positions amid a downward move. In case the pair trades sluggishly there, I would recommend selling GBP/USD immediately at the local high and even higher at 1.2450, bearing in mind a 30-35-pips downward move intraday.
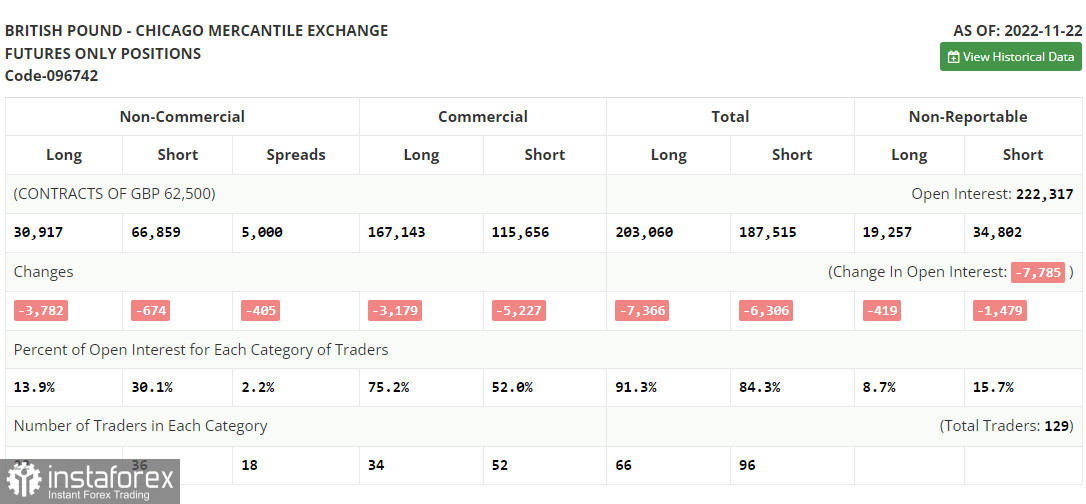
The COT report (Commitment of Traders) for November 22 recorded a decrease in both short positions and long positions. The fact of waning business activity in the British economy indicates that the economy is slipping into a recession. Notably, the Bank of England aims to sacrifice the national economic output for sake of its crusade against soaring inflation. Meanwhile, headline inflation has been still accelerating in the Kingdom as the latest data has shown. Against this background, it is not surprising why traders prefer to stay on the sidelines. They are not sure whether to buy or sell the pound. This week, the chairman of the Federal Reserve will tell the market about the agenda for monetary policy for the next year.
If the rhetoric of his statements does not match market expectations, the British pound will immediately come under selling pressure, leading to a fairly large sell-off of the pair at the end of this month and the beginning of next. The latest COT report indicated that long non-commercial positions decreased by 3,782 to 30,917, while short non-commercial positions declined by 674 to 66,859, which led to an increase in the negative value of the non-commercial net position to -35,942, against -32,834 a week earlier. GBP/USD closed last week higher at 1.1892 against 1.1885 a week ago.
Indicators' signals:
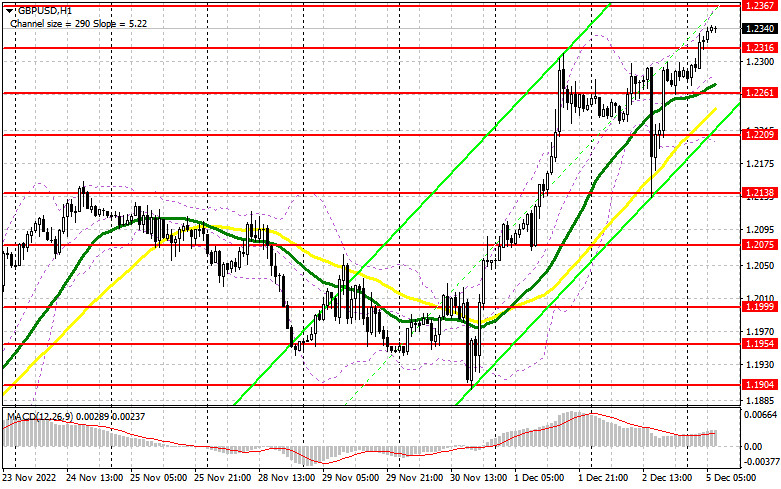
Trading is carried out above the 30 and 50 daily moving averages. It indicates a further growth of the sterling.
Moving averages
Note: The period and prices of moving averages are considered by the author on the H1 (1-hour) chart and differ from the general definition of the classic daily moving averages on the daily D1 chart.
Bollinger Bands
If GBP/USD keeps on trading higher, the indicator's upper border at 1.2367 will serve as resistance.
Description of indicators
- Moving average (moving average, determines the current trend by smoothing out volatility and noise). Period 50. It is marked yellow on the chart.
- Moving average (moving average, determines the current trend by smoothing out volatility and noise). Period 30. It is marked green on the chart.
- MACD indicator (Moving Average Convergence/Divergence — convergence/divergence of moving averages) Quick EMA period 12. Slow EMA period to 26. SMA period 9
- Bollinger Bands (Bollinger Bands). Period 20
- Non-commercial speculative traders, such as individual traders, hedge funds, and large institutions that use the futures market for speculative purposes and meet certain requirements.
- Long non-commercial positions represent the total long open position of non-commercial traders.
- Short non-commercial positions represent the total short open position of non-commercial traders.
- Total non-commercial net position is the difference between short and long positions of non-commercial traders.