empty
 
 
07.02.2023 07:28 AM
EUR/USD: Forecast and trading signals on February 7, 2023. COT report. Detailed analysis of price movement and trades

M5 chart of EUR/USD.

This image is no longer relevant

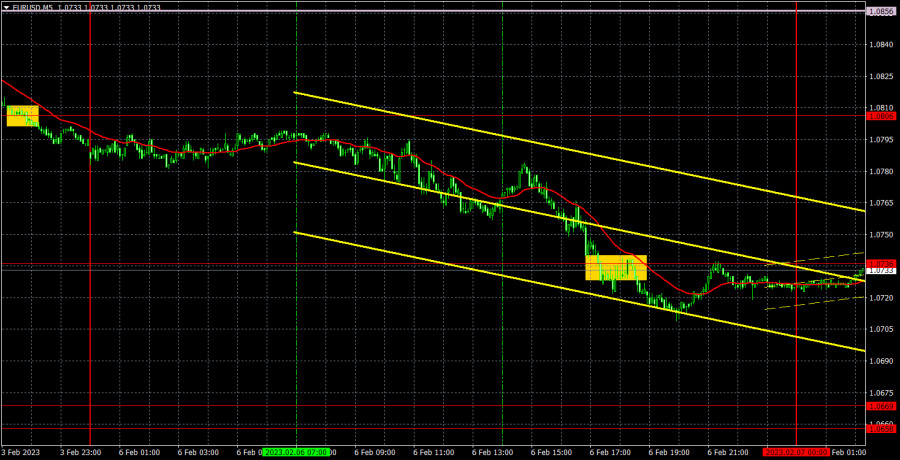
On Monday, the EUR/USD pair was bearish. In spite of the empty macroeconomic calendar, traders found a reason to sell the instrument. Yet, a couple of weeks ago, there was the opposite situation. Nevertheless, the eurozone saw the release of several macro reports. Thus, its services PMI rose to 46.1 in January, and retail sales dropped by 2.7% in December. However, the market showed no reaction to the results. The decline in EUR/USD came in the North American session. No macro releases were scheduled for the day in the United States. ECB President Lagarde's speech did not contain any new information or hints.

No trading signals were generated on Monday. Technically, there were two signals made. The first one was produced at the close of the market on Friday. The second one was formed on Monday night. Neither of them should have been priced. So, no positions were opened. Unfortunately, a good price movement on Monday was missed.

COT report:

This image is no longer relevant

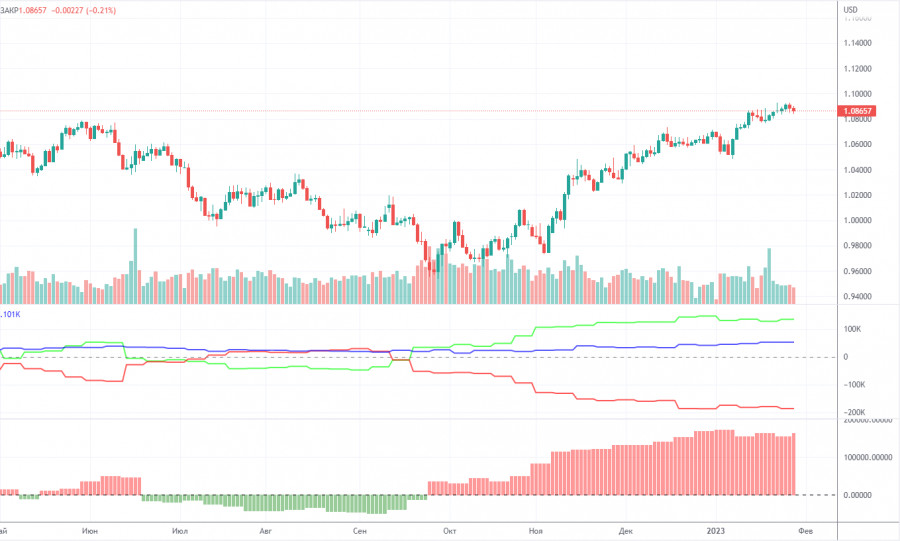
The COT reports on EUR/USD have been in line with expectations in recent months. The net non-commercial position has been on the rise since September. The bullish non-commercial position rises with each new week. Taking into account this fact, we may assume that the uptrend will soon come to an end. The red and green lines of the first indicator are far apart, which is usually a sign of the end of a trend. In the reporting week, non-commercial traders opened 9,500 long positions and 2,000 short ones. The net non-commercial position grew by 7,500. The number of long positions exceeds that of short ones by 134,000. It now remains to be seen how long large traders will be bullish. From the technical point of view, a bearish correction should have already occurred. Traders will unlikely stay bullish for another 2 or 3 months. Even the net non-commercial position shows that it is time for a correction. In total, there are 52,000 more long positions now among all groups of traders (732,000 vs 680,000).

H1 chart of EUR/USD.

This image is no longer relevant

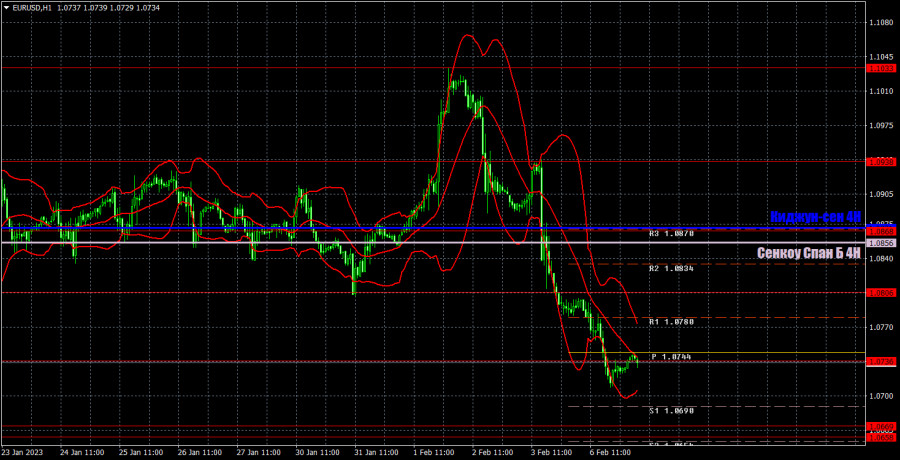
According to the H1 time frame, the pair is in a downtrend without any correction. On Monday, volatility somewhat decreased. The pair may tumble by 200-300 pips today. The tightening factor was priced by the market in December and January. On Tuesday, important levels are seen at 1.0485, 1.0581, 1.0658-1.0679, 1.0736, 1.0806, 1.0868, and 1.0938 as well as Senkou Span B (1.0856) and Kijun-sen (1.0871). Ichimoku indicator lines can move intraday, which should be taken into account when determining trading signals. There are also support and resistance although no signals are made near these levels. They could be made when the price either breaks or rebounds from these extreme levels. Don't forget to place Stop Loss at the breakeven point when the price goes by 15 pips in the right direction. In case of a false breakout, it could save you from possible losses. On February 7, the ECB's Isabel Schnabel and the Fed's Jerome Powell will deliver speeches. However, both policymakers are unlikely to share some new information since both central banks held their board meetings only last week. Therefore, the market will pay little attention to the officials' speeches.

Indicators on charts:

Resistance/support - thick red lines, near which the trend may stop. They do not make trading signals.

Kijun-sen and Senkou Span B are the Ichimoku indicator lines moved to the hourly timeframe from the 4-hour timeframe. They are also strong lines.

Extreme levels are thin red lines, from which the price used to bounce earlier. They can produce trading signals.

Yellow lines are trend lines, trend channels, and any other technical patterns.

Indicator 1 on the COT chart is the size of the net position of each trader category.

Indicator 2 on the COT chart is the size of the net position for the Non-commercial group of traders.

Paolo Greco,
Chuyên gia phân tích của InstaForex
© 2007-2023
EURUSD
Euro vs US Dollar
Select timeframe
5
min
15
min
30
min
1
hour
4
hours
1
day
1
week
Start trade
Start trade
  • Grand Choice
    Contest by
    InstaForex
    InstaForex always strives to help you
    fulfill your biggest dreams.
    THAM GIA CUỘC THI
  • Tiền gửi lần truy cập
    Ký quỹ tài khoản của bạn với $3000 và nhận được $8000 nhiều hơn!
    Trong Tháng 3 chúng tôi xổ $8000 trong chiến dịch Chancy Deposit!
    Có được một cơ hội giành chiến thắng bằng việc ký quỹ $3000 vào một tài khoản giao dịch. Đáp ứng được điều kiện này, bạn trở thành một người tham gia chiến dịch.
    THAM GIA CUỘC THI
  • Giao dịch khôn ngoan, thành công
    Nạp tiền vào tài khoản của bạn với ít nhất $ 500, đăng ký cuộc thi và có cơ hội giành được các thiết bị di động.
    THAM GIA CUỘC THI
  • 100% tiền thưởng
    Cơ hội duy nhất của bạn để nhận 100% tiền thưởng khi gửi tiền
    NHẬN THƯỞNG
  • 55% Tiền thưởng
    Đăng ký tiền thưởng 55% cho mỗi lần gửi tiền của bạn
    NHẬN THƯỞNG
  • 30% tiền thưởng
    Nhận 30% tiền thưởng mỗi khi bạn nạp tiền vào tài khoản của mình
    NHẬN THƯỞNG

Recommended Stories

EUR/USD and GBP/USD trading plan for beginners on March 28, 2023

EUR/USD began to rise at the start of the new trading week, which allowed the exchange rate to rise above 1.0800. After falling last March 23–24, the value

Gven Podolsky 11:33 2023-03-28 UTC+2

Trading plan for EUR/USD and GBP/USD on March 28

Pound recovered its losses and returned to last week's highs even though the macroeconomic calendar was empty yesterday and there were no statements from the Bank of England. This

Mark Bom 09:27 2023-03-28 UTC+2

Trading tips for oil

The previous trading plan for oil aimed to raise its rate in the market. That is exactly what happened this week, when the quote moved up and headed towards

Andrey Shevchenko 09:09 2023-03-28 UTC+2

Trading tips for EUR/USD

The trading plan presented on March 24 aimed to raise the rate of EUR/USD. That is exactly what happened this week, when the pair moved up and headed towards

Andrey Shevchenko 09:09 2023-03-28 UTC+2

EUR/USD: trading plan for European session on March 28. COT report. EUR continues recovering

Yesterday, traders received several signals to enter the market. Let us take a look at the 5-minute chart to figure out what happened. Earlier, I asked traders to pay attention

Miroslaw Bawulski 08:45 2023-03-28 UTC+2

GBP/USD: Forecast and trading signals on March 28. COT report. Detailed analysis of price movement and trades. "Swing" with an upward bias

On Monday, GBP/USD also moved with an upward bias, but at the same time, it constantly reversed and rolled back down throughout the day. As a result, we got something

Paolo Greco 08:44 2023-03-28 UTC+2

EUR/USD: Forecast and trading signals on March 28. COT report. Detailed analysis of price movement and trades. The euro aims to rise

On Monday, EUR/USD quietly started a new round of upward movement, despite overcoming the ascending trend line. So far this movement can be considered as an upward pullback, but settling

Paolo Greco 08:43 2023-03-28 UTC+2

Trading plan for US dollar index on March 27, 2023

The US dollar index dropped towards 102.20 intraday on Tuesday. The index should be well supported around 102.07 which is the Fibonacci 0.618 retracement of the recent lower-degree upswing between

Oscar Ton 08:10 2023-03-28 UTC+2

Trading plan for EURUSD on March 28, 2023

EURUSD has rallied in a corrective wave towards the 1.0815-20 zone intraday on Tuesday. The single currency might have faced resistance and is seen to be trading close to 1.0810

Oscar Ton 07:45 2023-03-28 UTC+2

How to trade GBP/USD on March 28. Simple trading tips and analysis for beginners

GBP/USD also corrected on Monday after Friday's fall and after breaking through the ascending trend line. Volatility was low - only about 75 pips. Bank of England Governor Andrew Bailey

Paolo Greco 04:42 2023-03-28 UTC+2
Không thể nói chuyện ngay bây giờ?
Đặt câu hỏi của bạn trong phần trò chuyện.